
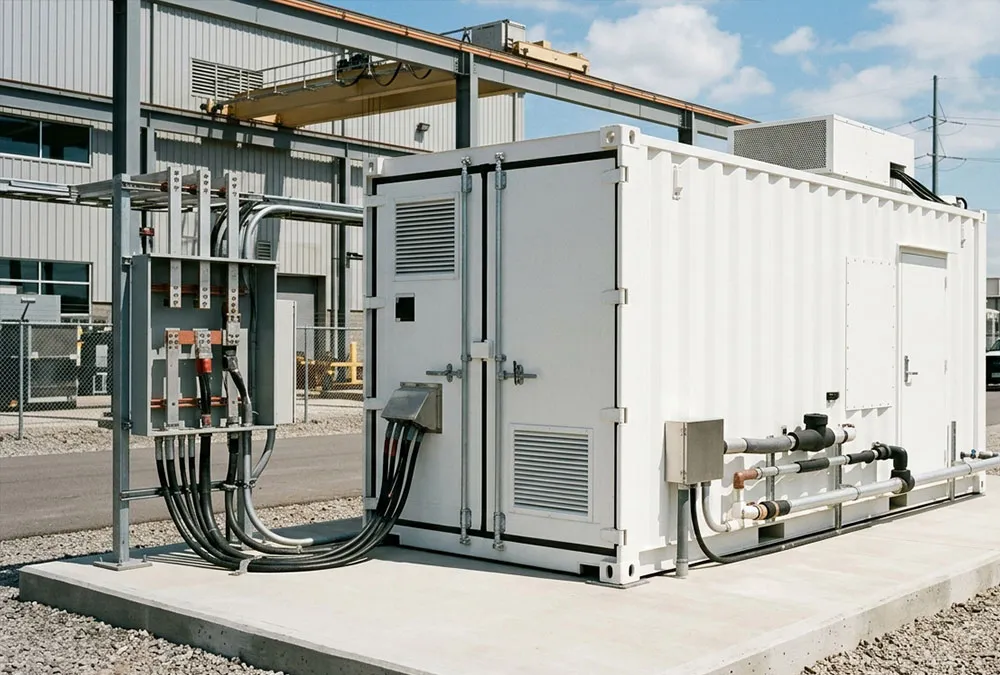
Introduction
When specifying industrial battery storage, understanding your system’s BESS C-Rate is the single most critical factor in balancing up-front capital outlay against long-term operational revenue. Put simply, C-rate is a ratio that describes how quickly a battery charges or discharges relative to its total energy capacity. It isn’t a static measurement of electrical output. In real engineering terms, a 1C rate on a 1 MWh battery system yields 1 MW of power, but that same 1C rate on a 2 MWh system delivers 2 MW. The math seems direct, yet I see project developers get tripped up here all the time by assuming 1C means a fixed 1 MW output across the board. Furthermore, actual AC output delivered to your facility or grid interconnect will often be lower or fluctuate significantly based on power conversion system (PCS) ratings, round-trip efficiency, temperature derating, state of charge (SOC) limits, and real-time auxiliary energy draws.
BESS C-Rate Quick Reference
*Note: These are simplified theoretical durations. Actual BESS duration depends on usable energy, SOC limits, Depth of Discharge (DoD), efficiency losses, ambient temperature, HVAC/auxiliary loads, and hardware derating.
What Is C-Rate in a BESS?
What Does C-Rate Mean for Battery Energy Storage?
Strip away the jargon, and what is C-rate in BESS design? At its fundamental core, battery C-rate represents the normalized speed at which a chemical energy storage system discharges or recharges relative to its maximum capacity. If you have a battery rated at a specific capacity, the C-rate acts as a multiplier that calculates how much current you can safely extract or push back in within a given timeframe without triggering thermal runaway or accelerated internal degradation.
What Does 0.5C, 1C and 2C Mean?
Let’s make this simple using basic system scale. The decimal or whole integer preceding the letter “C” tells you the fraction or multiple of total capacity delivered per hour:
- 0.5C (or C/2): The system takes 2 hours to fully charge or discharge its nominal capacity at continuous rated output.
- 1C: The system discharges its complete rated capacity in precisely 1 hour.
- 2C: The system pumps out full capacity in just 30 minutes (0.5 hours), pushing twice as much electrical current through the cells as a 1C system.
Why C-Rate Is a Ratio, Not a Fixed Power Rating
A common point of confusion among procurement teams is treating C-rate as an absolute megawatt figure. It isn’t. The foundational relationship governing direct current battery output is:
If an EPC contractor proposes a “1C battery,” you still know nothing about its actual grid-connected power until they tell you the stored energy footprint. A 500 kWh pack at 1C outputs 500 kW DC, whereas a 10 MWh utility container at 1C outputs 10 MW DC. Always evaluate both sides of the equation.
How Is BESS C-Rate Calculated?
BESS C-Rate Formula
When engineers run a BESS C-rate calculation, we isolate the DC battery rack metrics before accounting for inverter conversions. The standard battery C-rate calculation formula is expressed as:
How to Calculate C-Rate From MW and MWh
If you are asking how to calculate C-rate for battery energy storage setups on-site, divide the continuous power requirement by the total installed energy bank. Here is how varying ratios map out:
- 1 MW / 4 MWh = 0.25C (a 4-hour system)
- 1 MW / 2 MWh = 0.5C (a 2-hour system)
- 1 MW / 1 MWh = 1C (a 1-hour system)
How to Calculate Required Battery Capacity From C-Rate
Conversely, if your grid connection limits you to a target discharge profile, invert the formula to find your required energy bank:
Theoretical Full-Power Duration vs Real BESS Duration
On paper, theoretical duration is simple: Duration (Hours) = 1 ÷ C-Rate. A 0.5C system should run for precisely 2 hours at full power. But in field operations, real-world BESS discharge duration rarely hits that textbook line perfectly. Real system performance is heavily gated by:
- Usable vs. Nameplate battery energy limits
- Programmed State of Charge (SOC) buffers (e.g., maintaining 10%–90% window)
- Maximum Depth of Discharge (DoD) allowances set by warranty terms
- Inverter (PCS) and step-up transformer conversion losses
- HVAC liquid-cooling parasitic loads operating in extreme climates
C-Rate vs Power vs Energy vs Duration
Battery Energy Capacity: kWh and MWh
To master system architecture, you must separate energy from power. Battery energy capacity (measured in kilowatt-hours, kWh, or megawatt-hours, MWh) quantifies the total volume of electricity stored inside the electrochemical cells—think of it as the size of a fuel tank.
Battery Power Capacity: kW and MW
BESS power capacity (measured in kilowatts, kW, or megawatts, MW) measures how fast that energy can flow out of the system at any given instant—equivalent to the diameter of the fuel pipe.
C-Rate: The Relationship Between Power and Energy
This brings us directly to BESS C-rate vs power and energy dynamics. C-rate acts as the structural bridge linking your fuel volume (energy) to your maximum flow speed (power).
How C-Rate Relates to Discharge Duration
As C-rate increases, discharge duration decreases proportionally. Lower C-rates mean longer sustained operation at lower output levels, whereas higher C-rates compress energy delivery into high-intensity, short-duration windows.
Why the Same MWh Capacity Can Have Different Power Ratings
Consider a standardized 2 MWh battery enclosure. Depending on cell chemistry and thermal management design, manufacturers can configure that exact same 2 MWh container into radically different operational assets:
- Configured at 0.5C: Delivers 1 MW of power for approximately 2 hours.
- Configured at 1C: Delivers 2 MW of power for approximately 1 hour.
- Configured at 2C: Delivers 4 MW of power for approximately 30 minutes.
How Does C-Rate Work in a Real 261 kWh BESS?
Let’s anchor this theory into a standard industrial building block: a commercial liquid-cooled 261 kWh cabinet. How does C-rate dictate real-world DC output for this specific size?
- 261 kWh Battery at 0.5C:
261 kWh × 0.5 = 130.5 kW DC. Ideal for factory peak shaving across a 2-hour production shift. - 261 kWh Battery at 1C:
261 kWh × 1.0 = 261.0 kW DC. Excellent for solar smoothing and quick 1-hour demand charge mitigations. - 261 kWh Battery at 2C:
261 kWh × 2.0 = 522.0 kW DC. Tailored for heavy motor start-up current compensation or EV fast-charging buffers.
Why Actual AC Output May Be Different
A buyer might ask: “If my 261 kWh pack hits 261 kW DC at 1C, will I get 261 kW delivered to my facility’s main switchboard?” The short answer is no. You must trace the entire system conversion chain:
If your PCS inverter efficiency is 97% and auxiliary HVAC draws 3 kW during high ambient operations, your net AC power delivered to the site busbar will be roughly 250 kW AC—not 261 kW. Battery C-rate establishes potential DC chemistry performance; it does not automatically dictate final AC system output.
⚡ Recommended C&I Storage Solutions for Engineering Buyers
Matching your project’s load profile requires flexible, pre-engineered enclosures. Explore our industrial-grade, liquid-cooled system range:
- 100 kWh Outdoor Cabinet: Ultra-compact foot-print for small commercial facilities, optimized for 0.5C daily TOU shifting.
- 261 kWh All-in-One System: High-density liquid-cooled rack with integrated PCS, ideal for 0.5C to 1C factory peak shaving.
- 418 kWh Distributed Energy Unit: Modular scalability with smart HVAC for aggressive 1C demand charge reduction.
- 1 MWh / 2 MWh Containerized BESS: Utility and large C&I utility-scale solution, customizable for 0.25C 4-hour shifting or 1C grid support.
How Does C-Rate Affect BESS Performance?
C-Rate and Battery Power Output
Operating at elevated discharge rates allows a system to respond dynamically to massive load surges. However, pushing higher power out of a fixed battery enclosure forces internal cell chemistry to work exponentially harder.
C-Rate, Current and Voltage Drop
According to Joule’s Law ($P = I^2 R$), thermal heat generation inside a battery cell scales with the square of the current ($I$). Higher C-rate operational profiles demand dramatically higher current flow through internal busbars, cell tabs, and electrolyte matrices. This surge in current increases internal $I^2 R$ resistive losses, triggering localized voltage drop across the racks and reducing usable discharge voltage under heavy loads.
C-Rate and Thermal Stress
Heat is the ultimate enemy of lithium-ion chemistry. Operating at continuous 1C or 2C rates generates severe thermal gradients inside individual cells. According to testing metrics highlighted in the IEEE Transactions on Energy Conversion, sustained high-current operational profiles without aggressive active liquid cooling accelerate solid-electrolyte interphase (SEI) layer growth, leading to micro-cracking and rapid capacity loss.
C-Rate and Round-Trip Efficiency
A system operated at 0.25C or 0.5C will consistently deliver higher cell-level DC efficiency (often 95%–97%) compared to the same system forced to run at 2C (where efficiency can drop below 90% due to internal heat generation). Do not confuse raw battery cell efficiency with overall BESS round-trip efficiency (RTE), as system-level RTE also includes PCS losses, transformer impedance, and parasitic HVAC power consumption.
How Does C-Rate Affect Battery Life?
Does Higher C-Rate Always Reduce Battery Life?
Not necessarily. A widespread industry myth claims that operating at 1C will automatically destroy your battery bank in half the time of a 0.5C unit. While higher currents create mechanical and chemical stress, modern LFP (Lithium Iron Phosphate) cell manufacturing, advanced thermal management, and smart Battery Management Systems (BMS) allow premium cells to comfortably handle 1C continuous duty cycles without premature failure—provided operating temperatures remain strictly controlled between 20°C and 25°C.
Why High C-Rate Can Increase Battery Stress
Understanding how C-rate affects BESS battery life requires evaluating mechanical stress. High current rates induce rapid lithium-ion insertion and extraction within the graphite anode lattice. This fast intercalation causes physical expansion and contraction of active materials, gradually degrading mechanical integrity over thousands of cycles.
Charge C-Rate vs Discharge C-Rate
Never assume charging and discharging thresholds are symmetrical! Lithium batteries are far more sensitive to damage during charging than discharging. High BESS charging rate profiles (e.g., fast charging at 1C near high SOC levels) carry a severe risk of lithium plating on the anode, creating permanent capacity loss and internal short-circuit risks. Conversely, maximum BESS discharging rate limits are often significantly higher than charging limits.
Continuous C-Rate vs Peak C-Rate
Datasheets frequently advertise “2C Max Rate.” Buyers must clarify whether that means 2C continuous operation or a short 10-second peak pulse. Running a 2C peak-rated system continuously at 2C will void warranties and cause rapid thermal shutdowns.
Temperature, SOC and DoD Effects on Battery Degradation
To predict real-world lifetime, engineers evaluate a combined matrix:
Why C-Rate Alone Does Not Determine Cycle Life
According to research benchmarks published in the DNV Energy Transition Outlook Report, overall battery cycle life and long-term battery degradation are governed more by cumulative throughput energy, average state of charge, and cell thermal control than by peak C-rate alone. A well-cooled 1C battery operating in a 20%–80% SOC window will frequently outlive an uncooled 0.5C battery operating continuously at 100% SOC in high ambient heat.
Nameplate Capacity vs Usable Energy: The “Empty Tank” Problem
What Is Nameplate Battery Capacity?
Nameplate capacity is the factory-certified theoretical maximum energy stored in the battery cells under ideal laboratory testing conditions (typically 25°C at a slow 0.2C rate).
What Is Usable Battery Capacity?
Usable capacity is the real-world net energy your system can extract during daily operation after enforcing BMS protection limits, thermal derating, and DoD thresholds.
Why Usable Energy Matters When Calculating C-Rate
Here is where buyers get trapped. If you purchase a “1 MWh” battery system, but your software limits operation to 90% DoD to protect warranty terms, your usable energy capacity is only 900 kWh. If your plant demands 1 MW of power, calculating against nominal nameplate rating ($1\text{ MW} / 1\text{ MWh} = 1\text{C}$) misleads you. In reality, to draw 1 MW from a 900 kWh usable bank, your cells must discharge at:
That extra 0.11C stress raises operating temperatures, increases degradation, and cuts run-time short of your 1-hour requirement.
How SOC Limits and DoD Affect Real-World Duration
Always size your energy storage system using net usable energy capacity at End-of-Life (EOL), not Beginning-of-Life (BOL) nominal nameplate figures.
Battery C-Rate vs PCS Rating: From DC Battery Power to AC System Output
Battery C-Rate Determines Potential DC Power
The DC rack configuration establishes what the electrochemical cells are physically capable of releasing into the DC bus.
How PCS Rating Limits AC Power Output
The Power Conversion System (PCS) acts as the gateway. No matter how much DC power your battery chemistry can throw off, your AC delivery is hard-capped by the continuous megawatt rating of your inverter.
Battery DC Power vs PCS AC Power
If you connect a 2 MWh DC battery enclosure running at 1C (2 MW DC potential) to a 1 MW rated PCS inverter, your net AC system output is strictly 1 MW AC. Your system is effectively operating as a 0.5C system on the AC side!
Battery C-Rate and DC-to-AC System Design
Balancing the BESS power to energy ratio requires matching inverter capacity cleanly with cell discharge capability to prevent over-investing in unnecessary hardware on either side.
What Happens When Battery and PCS Ratings Are Mismatched?
- Oversized PCS / Undersized Battery: The inverter attempts to pull more current than the cell chemistry can deliver, triggering thermal shutdown or rapid cell degradation.
- Undersized PCS / Oversized Battery: Safe operation, but you paid for high C-rate battery cells whose full power capability remains permanently trapped behind an inverter bottleneck.
How to Choose the Right C-Rate for a BESS Project
When consulting on commercial projects, I use a systematic 10-step selection model to eliminate guesswork:
BESS C-Rate Selection Framework:
Application → Required Power → Required Energy → Duration → Duty Cycle → Temperature → Battery Limits → PCS Match → Warranty Terms → Lifecycle Economics
Step 1 — Define the Application
Identify your primary revenue driver: peak shaving, TOU arbitrage, solar shifting, emergency backup, or grid ancillary services.
Step 2 — Define Required Power
Determine the exact kW or MW peak output required to clamp facility demand spikes.
Step 3 — Define Required Energy
Calculate total energy (kWh or MWh) needed to sustain that load over time.
Step 4 — Define Required Duration
Determine your target operational window (e.g., 30 min, 1 hour, 2 hours, 4 hours).
Step 5 — Analyze the Duty Cycle
A frequent topic on engineering forums like Reddit is confusing average factory load with peak surge profile. Let’s look at a real-world sizing scenario:
Real-World Engineering Case:
- Average Facility Load: 500 kW
- Peak Spike Load: 1,500 kW (1.5 MW)
- Peak Duration: 20 minutes (0.33 hours)
- Peak Target Reduction: 1,000 kW (1 MW) peak shaving needed
Theoretical energy needed: 1,000 kW × 0.33 h = 333 kWh. Adding real-world safety factors (85% DoD allowance, 92% round-trip efficiency, temperature derating), you need a system delivering ~430 kWh usable energy. Running a 1 MW discharge against a 430 kWh bank requires a 2C battery storage configuration ($1000\text{ kW} / 430\text{ kWh} \approx 2.3\text{C}$ continuous burst).
Step 6 — Evaluate Temperature and Operating Conditions
Factor in site heat; ambient conditions above 40°C require cooling derating.
Step 7 — Check Continuous and Peak C-Rate
Verify cell manufacturer specification sheets for continuous limits vs. transient pulse limits.
Step 8 — Match Battery C-Rate With PCS Rating
Ensure inverter current parameters line up with DC battery rack voltage curves.
Step 9 — Check Warranty and EOL Performance
Confirm guaranteed usable capacity at year 10 under your expected daily C-rate duty cycle.
Step 10 — Compare Lifecycle Economics
Never default to the highest C-rate on the spec sheet. Choose the C-rate that satisfies power and duration requirements at the lowest Levelized Cost of Storage (LCOS).
What C-Rate Is Suitable for Different BESS Applications?
C-Rate for Commercial and Industrial Peak Shaving
Most BESS C-rate for commercial and industrial applications targets 0.5C to 1C. Peak demand windows in manufacturing plants usually span 1 to 2 hours. A 0.5C system offers an ideal balance of thermal stability and energy capacity.
C-Rate for Time-of-Use Energy Arbitrage
TOU arbitrage relies on energy shifting rather than high power bursts. Systems are designed for 0.25C to 0.5C (4-hour to 2-hour duration) to maximize stored kWh volume and capture price spreads between off-peak charging and peak discharge hours.
C-Rate for Solar + BESS
Solar shifting typically utilizes 0.25C to 0.5C to absorb broad photovoltaic generation curves across 3 to 5 afternoon hours.
C-Rate for Backup Power
Critical backup systems prioritize runtime duration over high C-rate bursts, leaning toward 0.25C (4-hour) configurations.
C-Rate for Grid Services
Frequency response and grid regulation require rapid, high-power injections. These utility setups employ 1C to 2C systems capable of instantaneous response.
C-Rate for EV Charging
Buffer storage for EV fast-charging stations varies depending on site design:
- To buffer a 500 kW EV charging load for 30 minutes:
500 kW × 0.5 h = 250 kWh. Rate required:500 kW ÷ 250 kWh = 2C. - To buffer that same 500 kW load for 2 hours:
500 kW × 2 h = 1,000 kWh (1 MWh). Rate required:500 kW ÷ 1000 kWh = 0.5C.
0.5C vs 1C vs 2C BESS: Which Design Fits Your Project?
Comparing a BESS 0.5C vs 1C or 2C setup requires weighing trade-offs across design priorities:
| Design Factor | 0.5C BESS | 1C BESS | 2C BESS | Buyer Benefit / Trade-off |
|---|---|---|---|---|
| Theoretical Duration | 2 Hours | 1 Hour | 30 Minutes | Lower C-rates offer longer continuous discharge coverage |
| Thermal Load & Cooling | Low / Moderate | Moderate / High | Very High | 0.5C reduces liquid HVAC parasitic energy consumption |
| Energy Shifting ROI | Excellent | Moderate | Poor | 0.5C maximizes total kWh yield for daily TOU spread |
| Peak Power Density | Moderate | High | 2C delivers massive megawatt power in tight footprints |
BESS C-Rate Calculation Examples
Example 1 — 1 MW / 4 MWh BESS
1 MW ÷ 4 MWh = 0.25C
This represents a classic 4-hour utility-scale energy shifting asset designed to absorb excess solar and discharge across evening grid peak hours.
Example 2 — 1 MW / 2 MWh BESS
1 MW ÷ 2 MWh = 0.5C
The standard 2-hour benchmark for industrial peak shaving, offering a balance between hardware cost and power output.
Example 3 — 1 MW / 1 MWh BESS
1 MW ÷ 1 MWh = 1C
A fast 1-hour power system engineered for fast demand response, solar ramp control, and industrial motor buffer applications.
Example 4 — 2 MW / 1 MWh BESS
2 MW ÷ 1 MWh = 2C
A high-power burst configuration tailored for short 30-minute frequency regulation or heavy EV charging station support.
BESS C-Rate Specifications, Testing and Warranty
How C-Rate Is Specified in a BESS Datasheet
Never accept a single floating C-rate figure on a procurement spec sheet. A complete OEM technical datasheet must clearly state continuous charge/discharge C-rates, peak pulse rates, and rated ambient operating temperatures.
Is the C-Rate Guaranteed at BOL or EOL?
A system rated for 1C at Beginning-of-Life (BOL) may experience increased internal resistance as cells age. By End-of-Life (EOL, typically 70% or 80% remaining capacity), delivering that same continuous power output pushes individual cells to a higher effective C-rate, increasing heat generation.
What Test Conditions Should Buyers Ask For?
Demand factory acceptance test (FAT) documentation showing performance validated under standard international safety and compliance benchmarks, including UL 9540A thermal runaway testing, IEC 62619 industrial lithium safety standards, and NFPA 855 fire protection compliance.
Cell C-Rate vs Pack C-Rate vs BESS System Power
Performance bottlenecks accumulate across hardware integration tiers:
A single prismatic cell might carry a 2C laboratory rating. However, once packaged into tight modules, racked inside containers, and governed by overall system thermal dissipation, the entire enclosure may be derated to 0.5C or 1C continuous AC output to protect hardware life.
Common BESS C-Rate Mistakes and Misconceptions
- Mistake 1 — Confusing C-Rate With Power: Expecting every 1C battery to equal 1 MW without checking total stored MWh capacity.
- Mistake 2 — Treating Peak C-Rate as Continuous: Running a 10-second 2C pulse rating for continuous 30-minute shifts, resulting in system trips.
- Mistake 3 — Ignoring Temperature Derating: Expecting 1C continuous discharge in 45°C ambient heat without active liquid cooling.
- Mistake 4 — Mismatching Battery and PCS: Pairing a high-power 2C battery with an undersized inverter, trapping capacity behind an AC bottleneck.
- Mistake 5 — Calculating With Nameplate Capacity: Forgetting that 10%–15% unusable SOC buffer shifts effective operational C-rate higher.
BESS C-Rate Procurement Checklist
Use this structured audit table when reviewing technical proposals from energy storage system integrators:
| Procurement Audit Item | What Buyers Should Verify | Target Standard / Red Flag |
|---|---|---|
| Usable Energy Base | Is C-rate calculated on nominal nameplate or net usable kWh? | Red Flag: OEM calculates runtime on 100% nominal DoD. |
| Continuous Discharge Rate | What is the sustained continuous discharge C-rate at 25°C? | Target: 0.5C to 1C continuous depending on application. |
| Continuous Charge Rate | Is maximum charging C-rate equal to discharge C-rate? | Warning: Charging is often derated to 0.5C to prevent lithium plating. |
| PCS AC Alignment | Does inverter AC kVA rating match DC rack peak power output? | Target: Inverter capacity matched to required site AC peak load. |
| Warranty C-Rate Terms | What maximum daily C-rate and cycle count bound the warranty? | Target: Guaranteed cycle life backed under actual site duty cycle. |
BESS C-Rate FAQ
What is C-rate in BESS?
C-rate in a Battery Energy Storage System (BESS) is a normalized ratio representing charge or discharge speed relative to total stored energy capacity. A 1C rate fully discharges a battery in 1 hour, while a 0.5C rate discharges it in 2 hours.
How do you calculate BESS C-rate?
Divide continuous DC power output (kW or MW) by total nominal energy capacity (kWh or MWh). For example, a 500 kW output from a 1,000 kWh battery equals a 0.5C rate.
What does 0.5C mean in battery storage?
0.5C means the battery system can deliver continuous power equal to half its total energy rating, providing approximately 2 hours of full-power discharge runtime.
What is the difference between 0.5C, 1C and 2C?
The primary difference is discharge duration and current intensity: 0.5C runs for ~2 hours (energy-oriented), 1C runs for ~1 hour (balanced), and 2C runs for ~30 minutes (high power).
Does a higher C-rate reduce battery life?
Higher C-rates generate greater internal thermal stress and accelerated degradation if unmitigated. However, premium LFP batteries equipped with active liquid cooling handle 1C duty cycles safely.
What is the difference between battery C-rate and PCS power?
Battery C-rate defines potential DC power output from the chemical cells. PCS power is the maximum AC output delivered by the inverter hardware to the facility switchboard.
What C-rate is best for a commercial BESS?
0.5C to 1C is typically ideal for commercial and industrial facilities, matching standard 1- to 2-hour daily peak shaving windows.
Does C-rate affect BESS cost?
Yes. Higher C-rate systems require heavier busbars, higher-rated inverters, and liquid cooling systems, which can increase CAPEX per kWh stored.
🧮 BESS C-Rate & Duration Estimator
Quickly check your project parameters using this sizing logic reference:
1,000 kWh Capacity / 500 kW Power
Result: 0.5C Rate (~2 Hrs Duration)
2,000 kWh Capacity / 2,000 kW Power
Result: 1.0C Rate (~1 Hr Duration)
Need an exact simulation considering thermal derating, PCS efficiency, and SOC windows?
Need Help Selecting the Right BESS C-Rate?
Tell us your required peak kW demand, total energy capacity, discharge duration, and facility operating profile. Our application engineering team will model an optimized BESS configuration, PCS pairing, and battery degradation profile tailored to your site economics.
 https://anengjipower.com/wp-content/uploads/2026/06/epc-vs-turnkey-solar-project-bess.webp
675
1000
Charging Station Engineer
https://anengjipower.com/wp-content/uploads/2025/09/anengji-dc-fast-charging-station-manufacturer-and-supplier-logo-white-1.png
Charging Station Engineer2026-06-22 07:16:042026-06-24 07:13:17What Is the Difference Between EPC and Turnkey Contract Models in Energy Projects?
https://anengjipower.com/wp-content/uploads/2026/06/epc-vs-turnkey-solar-project-bess.webp
675
1000
Charging Station Engineer
https://anengjipower.com/wp-content/uploads/2025/09/anengji-dc-fast-charging-station-manufacturer-and-supplier-logo-white-1.png
Charging Station Engineer2026-06-22 07:16:042026-06-24 07:13:17What Is the Difference Between EPC and Turnkey Contract Models in Energy Projects? https://anengjipower.com/wp-content/uploads/2026/06/anengji-commercial-solar-plus-storage-benefits-site.webp
675
1000
Charging Station Engineer
https://anengjipower.com/wp-content/uploads/2025/09/anengji-dc-fast-charging-station-manufacturer-and-supplier-logo-white-1.png
Charging Station Engineer2026-06-20 14:34:102026-06-20 14:37:43What Are the Top Benefits of Solar Battery Storage in Factories?
https://anengjipower.com/wp-content/uploads/2026/06/anengji-commercial-solar-plus-storage-benefits-site.webp
675
1000
Charging Station Engineer
https://anengjipower.com/wp-content/uploads/2025/09/anengji-dc-fast-charging-station-manufacturer-and-supplier-logo-white-1.png
Charging Station Engineer2026-06-20 14:34:102026-06-20 14:37:43What Are the Top Benefits of Solar Battery Storage in Factories? https://anengjipower.com/wp-content/uploads/2026/06/modular-commercial-solar-battery-storage-cabinet.webp
675
1000
Charging Station Engineer
https://anengjipower.com/wp-content/uploads/2025/09/anengji-dc-fast-charging-station-manufacturer-and-supplier-logo-white-1.png
Charging Station Engineer2026-06-18 09:16:522026-07-03 03:05:13What Is Solar Battery Storage? Complete C&I Engineering Guide
https://anengjipower.com/wp-content/uploads/2026/06/modular-commercial-solar-battery-storage-cabinet.webp
675
1000
Charging Station Engineer
https://anengjipower.com/wp-content/uploads/2025/09/anengji-dc-fast-charging-station-manufacturer-and-supplier-logo-white-1.png
Charging Station Engineer2026-06-18 09:16:522026-07-03 03:05:13What Is Solar Battery Storage? Complete C&I Engineering Guide


Leave a Reply
Want to join the discussion?Feel free to contribute!