
Introduction
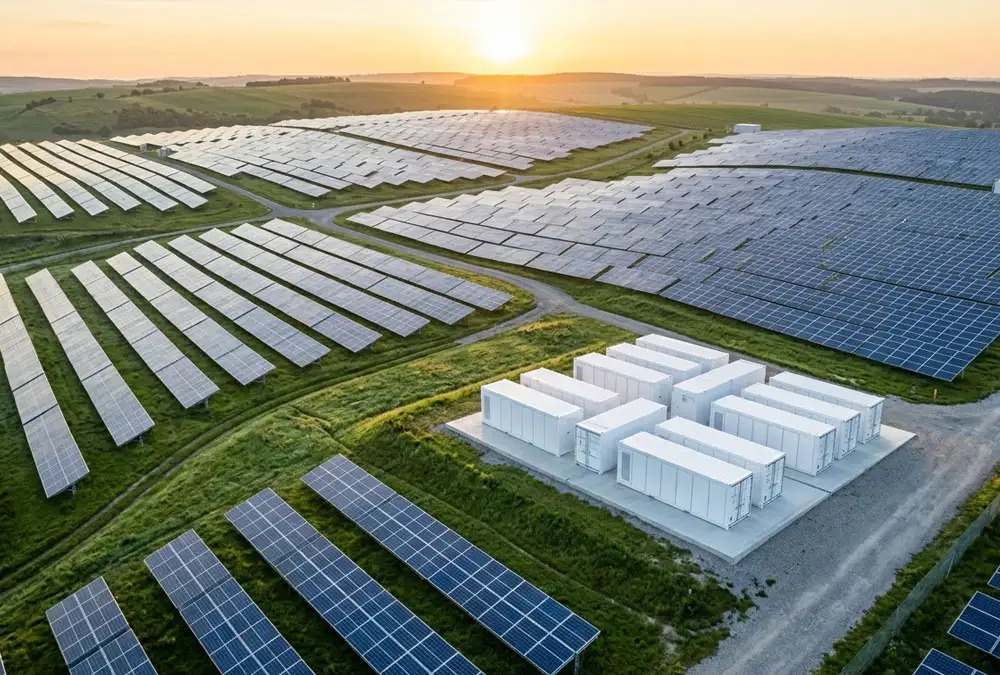
Building a solar energy power plant in Europe is no longer just about buying modules and dropping them on a field. Grid queues across DSOs like Iberdrola, Enedis, and Westnetz are severely congested, while negative electricity price hours on EPEX SPOT jumped above 1,000 hours across Central Europe last year. A 5 MW solar PV system hits a sweet spot for commercial IPPs looking for utility-scale cash flows without triggering complex regional Environmental Impact Assessment (EIA) thresholds that delay 50MW+ sites for years. This guide breaks down exact EPC cost benchmarks, land constraints, energy output calculations, financial payback models, and battery energy storage (BESS) sizing based on verifiable European market data.
💡 Buyer’s Reality Check: “Why is my grid connection quote twice the price of my inverter hardware?”
A common shock for European developers is discovering that local distribution system operators (DSOs) demand expensive line extensions or substation transformer retrofits. Never assume a nearby 20kV or 33kV line has available thermal headroom. Always secure a preliminary grid capacity response before signing binding land leases or purchasing solar PV modules.
5MW Solar Power Plant at a Glance
Before diving into civil engineering or procurement contracts, developers must establish strict capacity metrics across electrical conversion stages.
What Does 5MW Mean?
In utility-scale engineering, “5MW” can mean 5 megawatt-peak (MWp) DC capacity from the panel array, or 5 megawatt (MWac) nominal power rating at the inverter terminals. Clarifying this distinction early prevents massive engineering miscalculations during EPC contract negotiation.
5MW DC vs 5MW AC vs Grid Export Capacity
The capacity chain moves from direct current generation to medium-voltage grid injection. Oversizing the DC array relative to the inverter rating creates a DC/AC ratio (or Inverter Loading Ratio) between 1.20 and 1.35, ensuring maximum inverter utilization throughout the shoulder hours of the day.
| Factor | 5MW Solar Project Baseline | Primary Engineering Impact | Buyer Advantage |
|---|---|---|---|
| Rated Capacity | 5.0 MWac Inverter / 6.0–6.5 MWp DC Array | Determines overall field racking layout and string combiner sizing. | Generates maximum daily energy without exceeding grid inverter limits. |
| DC/AC Ratio | 1.20 to 1.35 Typical Ratio | Compensates for thermal panel degradation and winter light losses. | Flattens production curves to supply stable AC power longer into the afternoon. |
| Annual Generation | 5,200 MWh to 9,500 MWh (Location dependent) | Driven by regional GHI/POA irradiance level and tracker usage. | Provides predictable baseline power to secure long-term PPA off-take deals. |
| Land Requirement | 4.5 to 7.5 Hectares (11 to 18 Acres) | Varies based on fixed-tilt versus single-axis tracker row spacing. | Optimizing module tilt reduces lease expense while avoiding row shading. |
| CAPEX Benchmark | €3.2M to €4.8M Total EPC Cost | Includes civil site works, modules, inverters, and grid connection. | Competitive turn-key engineering keeps payback timelines under 7 years. |
| BESS Integration | Optional (2 MW / 4 MWh to 5 MW / 10 MWh) | Requires AC or DC coupling with energy management controls. | Prevents midday energy curtailment during grid capacity shutdowns. |
How Does a 5MW Solar Power Plant Work?
A utility-scale 5 MW photovoltaic power plant operates as a synchronized energy conversion facility converting solar photons directly into grid-compliant high-voltage alternating current.
PV Modules Generate DC Power
Monocrystalline N-type TOPCon or PERC photovoltaic modules capture solar irradiance, generating low-voltage direct current (DC). Modules are connected in series strings up to 1,500V DC to minimize cable resistive losses across the field layout.
Inverters Convert DC to AC
High-capacity 1,500V string inverters (250kW–350kW) or central inverter stations aggregate incoming DC strings and convert them into 3-phase alternating current (AC) at typical low-voltage levels between 600V and 800V.
Transformers and MV Equipment
A pad-mounted step-up transformer immediately steps up low inverter voltage to medium voltage levels (typically 10kV, 20kV, or 33kV in European distribution networks) to facilitate efficient long-distance site power transmission.
Grid Connection and SCADA
Power flows through protective medium-voltage switchgear, utility revenue metering bays, and circuit breakers at the Point of Interconnection (POI). Real-time SCADA systems continuously regulate dynamic grid code parameters, frequency compliance, and reactive power control.
How Many Solar Panels and How Much Land Does a 5MW Solar Plant Need?
How Many Solar Panels Are Needed for 5MW?
Total module count depends directly on selected panel power rating and target DC oversizing. Assuming modern high-efficiency 580W N-type TOPCon bifacial modules:
- For a nominal 5.0 MWp DC array: 5,000,000W ÷ 580W ≈ 8,620 PV modules
- For an optimized 6.25 MWp DC array (1.25 DC/AC Ratio): 6,250,000W ÷ 580W ≈ 10,775 PV modules
Gross Land Area vs Usable Solar Area
Evaluating 5 MW solar farm land requirements requires distinguishing raw panel footprint from gross site area. While 10,000 physical panels cover around 2.6 hectares of glass surface, total parcel requirements are larger to account for inter-row shading pitch, access maintenance corridors, and inverter stations.
What Affects Land Requirements?
European site layouts require 1.0 to 1.3 hectares per MWp for fixed-tilt mounting (south-facing 25°–30° tilt) and 1.5 to 1.9 hectares per MWp for single-axis trackers due to wider pitch row spacing. Additional land factors include site slope, perimeter security setbacks, stormwater drainage basins, and substation footprint.
How Much Electricity Can a 5MW Solar Power Plant Generate?
5MW Capacity vs Annual MWh Yield
Installed capacity (MW) represents nominal potential, but annual yield (MWh) dictates financial cash flow. Based on validated satellite irradiance data from the European Commission Photovoltaic Geographic Information System (PVGIS), generation ranges substantially by latitude:
- Northern / Central Europe (e.g., Germany, Poland, Netherlands): ~980 to 1,120 kWh/kWp ➔ 6,120 MWh to 7,000 MWh annually (for a 6.25 MWp array).
- Southern Europe (e.g., Spain, Southern Italy, Greece): ~1,450 to 1,750 kWh/kWp ➔ 9,060 MWh to 10,930 MWh annually (for a 6.25 MWp array).
What Affects Solar Output?
Actual performance depends on plane-of-array (POA) irradiance, ambient thermal degradation losses, module temperature coefficient (-0.29%/°C for N-type), inverter conversion efficiency (98.8%), and overall site Performance Ratio (PR), which ranges between 81% and 86% in modern European installations.
📊 Industry Intelligence & Citation Report Data
According to the SolarPower Europe EU Market Outlook for Solar Power 2024–2028, utility-scale PV additions reached record levels across Europe, driven by long-term corporate PPAs and stringent EU Renewable Energy Directive (RED III) targets.
Furthermore, technical research published by the National Renewable Energy Laboratory (NREL) highlights that coupling utility PV with liquid-cooled storage systems drastically improves grid interconnection stability and resolves local feeder thermal congestion.
Detailed guidelines from the U.S. Department of Energy (DOE) FEMP Storage & Grid Guidelines and technical papers from NREL Site-Integrated Infrastructure Research establish the operational framework for managing site-integrated charging and bi-directional storage nodes.
How Do You Choose a Site for a 5MW Solar Power Plant in Europe?
Finding land with high solar resource is worthless if civil remediation or grid connection upgrades destroy project returns. Developers apply strict screening filters:
Solar Resource and Terrain
Selecting flat or gently south-facing terrain (<5% slope) minimizes cut-and-fill civil earthworks. Avoid flood risk zones (100-year floodplains), high water tables that increase pile foundation depth, or severe shading from adjacent forestry.
Land Availability and Planning Constraints
European planning authorities heavily restrict agricultural land rezoning. Developers prioritize industrial brownfield sites, degraded land, or lower-tier agricultural zones permitted for agrivoltaic dual-use under regional planning frameworks.
Distance to Substation and Grid Access
Distance to the designated Point of Interconnection (POI) dictates civil trenching budgets. Underground medium-voltage cable routing across Europe averages €90,000 to €160,000 per kilometer, meaning a 5km trench route can quickly add €750,000 to balance-of-system CAPEX.
How Is a 5MW Solar Power Plant Connected to the European Grid?
Point of Interconnection (POI) and Grid Capacity
A 5 MW solar power plant grid connection almost universally connects to local medium-voltage distribution networks (10kV, 20kV, or 33kV). Interconnecting directly into high-voltage transmission lines (110kV+) is rarely economically viable for a 5MW asset due to primary bay transformer costs exceeding €1.8 million.
Why Nearby Lines Do Not Guarantee Connection
Seeing distribution lines adjacent to your property line does not confirm hosting capacity. Distribution feeders in solar-dense regions often suffer from thermal overload or severe voltage rise risks. DSOs mandate formal grid impact studies to verify if the circuit can accommodate 5MW of continuous solar power injection.
How Much Does a 5MW Solar Power Plant Cost in Europe?
European Solar Cost Benchmark Data
According to the Fraunhofer Institute for Solar Energy Systems (ISE) Photovoltaics Report and International Renewable Energy Agency (IRENA) cost data, turn-key ground-mounted PV CAPEX in Europe averages €0.55 to €0.78 per watt-DC (€550,000 to €780,000 per MWp). Total turnkey CAPEX for a 6.25 MWp / 5.0 MWac utility asset typically falls between €3.4 million and €4.6 million.
| Cost Layer | Includes Equipment & Scope | Typical % of CAPEX | Buyer Cost Advantage |
|---|---|---|---|
| PV Modules | Tier-1 N-type TOPCon bifacial glass-glass panels | 32% – 38% | Direct factory bulk procurement locks in long-term performance warranties. |
| Inverters & Racking | 1500V String inverters, steel racking / single-axis trackers | 18% – 22% | Standardizing string inverter spares simplifies ongoing field maintenance. |
| Electrical & Civil BOS | DC/AC cabling, pad transformer, switchgear, site grading, roads | 20% – 24% | Optimizing cable trench routing cuts copper and aluminum conductor expenses. |
| Grid Connection | Utility extension line, metering bay, DSO interconnection fees | 8% – 15% | Selecting parcels close to existing substations avoids costly line rebuilds. |
| EPC & Soft Costs | Detailed engineering, permitting, environmental studies, project management | 8% – 12% | Turn-key EPC contracts shift construction execution and yield risks to the contractor. |
Is a 5MW Solar Power Plant Profitable in Europe?
Annual Revenue Structures: PPA vs Merchant Power
5 MW solar power plant ROI Europe projects deliver cash flows via long-term Corporate PPAs (€55 to €80/MWh fixed pricing) or via spot merchant trading on wholesale exchanges like EPEX SPOT. Unhedged merchant assets increasingly suffer during sunny hours when power prices cannibalize toward zero.
OPEX, Financial Model and Payback Timeline
According to benchmark reports from Wood Mackenzie Power & Renewables, annual operational expenditure (OPEX) averages €10,000 to €15,000 per MWp annually, covering preventative maintenance, security monitoring, land lease fees, insurance, and asset management.
Illustrative 5MW Financial Model (Southern/Central Europe Hybrid):
Annual Generation (7,800 MWh) × Realized Electricity Price (€68/MWh) = €530,400 Gross Revenue
Less Annual OPEX (€70,000) = €460,400 Net Operating Income (NOI)
Project CAPEX (€3.7 Million) ➔ Unlevered Equity Payback: ~6.8 to 8.0 Years | Project IRR: 8.8% – 11.5%
What Is the Development Process for a 5MW Solar Power Plant?
Developing a ground-mounted solar asset requires navigating structured project gates:
- Phase 1 — Site Identification & Feasibility (Months 1–4): Securing land lease option agreements and performing initial solar yield modeling.
- Phase 2 — Grid Application & Environmental Permitting (Months 5–14): Securing binding DSO connection offers and local planning authority construction permits.
- Phase 3 — EPC Procurement & Project Financing (Months 12–18): Finalizing turn-key EPC engineering contracts and securing non-recourse debt financing.
- Phase 4 — EPC Construction & Commissioning (Months 18–24): Civil earthworks, pile driving, rack assembly, wiring, hot commissioning, and final grid sync.
What Can Delay or Increase the Cost of a 5MW Solar Project?
5 MW solar PV project development Europe programs frequently run into operational friction:
- DSO Interconnection Backlogs: Grid application processing can stretch up to 24 months in overloaded regional networks.
- Environmental Compliance Holds: Uncovering protected wildlife species or historic artifacts during civil site trenching.
- Uncompensated Generation Curtailment: Local transmission constraints forcing DSOs to shut off solar inverters during peak afternoon hours.
When Does a 5MW Solar Power Plant Need Battery Energy Storage?
As negative price hours increase across European day-ahead power markets, adding battery storage turns a 5 MW solar farm with battery storage into a flexible, dispatchable power generator.
Primary BESS Use Cases for Solar Generators
- Avoiding Negative Electricity Prices: Charging batteries when wholesale prices collapse to zero and discharging energy during peak evening pricing hours.
- Bypassing Grid Export Caps: If a DSO limits a 5MW plant to a 3MW export ceiling, storage captures the 2MW power gap instead of clipping inverters.
- Providing Grid Ancillary Services: Participating in high-value grid balancing markets like Frequency Containment Reserve (FCR) and automatic Frequency Restoration Reserve (aFRR).
How to Size BESS for a 5MW Solar Plant?
Sizing depends directly on target duration and export limits. For a 5MW solar plant constrained by a 3MW export cap, storing a 2MW generation peak across 2 hours requires a 2 MW / 4 MWh modular BESS unit as an initial baseline.
Recommended Commercial BESS Solutions for Industrial & Solar Projects
Integrating industrial energy storage allows commercial site hosts and utility developers to optimize site power flow, eliminate peak charges, and prevent generation curtailment.
| Storage Capacity | Target Industrial Application | Core Functional Highlight | Buyer Selection Benefit |
|---|---|---|---|
| 100 kWh BESS Cabinet | Commercial retail roofs, small manufacturing | Compact all-in-one footprint, outdoor rated | Reduces facility demand charges with easy outdoor concrete pad installation. |
| 261 kWh Liquid-Cooled BESS | Medium industrial plants, EV charge hubs | Liquid thermal management, high energy density | Extends battery lifespan under continuous, heavy daily charge/discharge cycling. |
| 418 kWh – 1 MWh Modular Container | 5MW Solar farms, large industrial parks | Integrated PCS, liquid cooling, grid isolation controls | Captures clipped solar power while providing full off-grid emergency power backup. |
⚙️ Technical Explainer: Battery Chemistry & EV Charging Architecture
LFP (Lithium Iron Phosphate): The dominant stationary BESS chemistry offering higher thermal stability, enhanced safety, and 6,000+ deep charge cycles compared to NMC (Nickel Manganese Cobalt) alternatives.
DC Fast Charging (DCFC) vs AC Charging: AC chargers rely on an electric vehicle’s internal onboard charger, limiting speed to 7kW–22kW. DC Fast Chargers bypass onboard constraints, delivering direct high-voltage power (150kW–360kW) for rapid fleet replenishment.
BESS Buffer Charging Alternative: Adding a local battery buffer allows operators to deploy ultra-fast EV chargers on weak grid lines without incurring multi-hundred-thousand-euro transformer capacity upgrade fees.
How to Evaluate a 5MW Solar EPC Contractor in Europe
Selecting a qualified 5 MW solar power plant EPC contractor Europe partner dictates whether your project achieves Commercial Operation Date (COD) on schedule or suffers execution delays.
| Evaluation Vector | Why It Matters | Buyer Selection Advantage |
|---|---|---|
| Engineering Capability | In-house civil, structural, and MV electrical engineering talent. | Prevents expensive site redesigns and simplifies DSO grid approval cycles. |
| DSO Interconnect Experience | Proven track record commissioning medium-voltage utility substations. | Prevents grid sync delays during final hot commissioning tests. |
| Procurement Scale | Direct tier-1 factory supply agreements for modules and inverters. | Secures competitive pricing and firm equipment delivery timelines. |
| Solar + BESS Capability | Hands-on experience configuring hybrid Energy Management Systems (EMS). | Ensures smooth controls integration between solar inverters and battery storage skids. |
| Warranty & O&M Backing | Turn-key performance ratio guarantees and long-term O&M response SLAs. | Protects project revenue and simplifies debt financing approval. |
EPC Contractor vs Equipment Supplier
An equipment supplier sells modules or inverters at the factory gate. A turn-key EPC contractor manages total engineering design, civil construction, permitting compliance, and grid interconnection—delivering a commissioned, bankable solar asset under a unified warranty.
5MW Solar Power Plant Frequently Asked Questions
Does 5MW Mean 5MW AC or 5MW DC?
In utility interconnection contracts, 5MW specifies maximum AC export limit. To optimize generation, EPC contractors install a larger DC array (typically 6.0 MWp to 6.5 MWp DC).
How Many Solar Panels Are Needed for 5MW?
A 5 MWp DC array uses roughly 8,620 panels rated at 580W. An optimized 6.25 MWp DC array requires approximately 10,775 modules.
How Much Land Does a 5MW Solar Farm Need?
Fixed-tilt ground systems require 4.5 to 6.5 hectares (11 to 16 acres), while single-axis tracking systems require up to 8 hectares due to inter-row pitch spacing.
How Much Electricity Does a 5MW Solar Plant Generate?
Annual output spans 6,100 MWh to 7,000 MWh in Central Europe, reaching up to 10,900 MWh in Southern Europe under high irradiance levels.
How Much Does a 5MW Solar Power Plant Cost in Europe?
Turn-key EPC costs range between €0.55 and €0.78 per watt-DC, placing total CAPEX for a 6.25MWp array between €3.4 million and €4.6 million.
What Grid Connection Does a 5MW Solar Plant Need?
5MW power plants connect to local medium-voltage distribution networks (10kV, 20kV, or 33kV) via dedicated step-up transformers and MV switchgear.
Is a 5MW Solar Farm Profitable in Europe?
Yes. Backed by corporate PPAs or government feed-in premium schemes, well-sited 5MW plants deliver project IRRs between 8.8% and 11.5% with equity paybacks under 8 years.
Does a 5MW Solar Plant Need BESS?
Integrating battery storage prevents generation curtailment during negative wholesale price hours and generates additional revenue through grid ancillary services.
Request a 5MW Solar + BESS Project Assessment
Planning a 5MW solar power plant or industrial energy storage facility in Europe? Share your parcel coordinates, DSO grid status, and operational goals with our engineering consultants for a preliminary yield simulation and turnkey EPC quotation.
 https://anengjipower.com/wp-content/uploads/2026/06/epc-vs-turnkey-solar-project-bess.webp
675
1000
Charging Station Engineer
https://anengjipower.com/wp-content/uploads/2025/09/anengji-dc-fast-charging-station-manufacturer-and-supplier-logo-white-1.png
Charging Station Engineer2026-06-22 07:16:042026-06-24 07:13:17What Is the Difference Between EPC and Turnkey Contract Models in Energy Projects?
https://anengjipower.com/wp-content/uploads/2026/06/epc-vs-turnkey-solar-project-bess.webp
675
1000
Charging Station Engineer
https://anengjipower.com/wp-content/uploads/2025/09/anengji-dc-fast-charging-station-manufacturer-and-supplier-logo-white-1.png
Charging Station Engineer2026-06-22 07:16:042026-06-24 07:13:17What Is the Difference Between EPC and Turnkey Contract Models in Energy Projects? https://anengjipower.com/wp-content/uploads/2026/06/anengji-commercial-solar-plus-storage-benefits-site.webp
675
1000
Charging Station Engineer
https://anengjipower.com/wp-content/uploads/2025/09/anengji-dc-fast-charging-station-manufacturer-and-supplier-logo-white-1.png
Charging Station Engineer2026-06-20 14:34:102026-06-20 14:37:43What Are the Top Benefits of Solar Battery Storage in Factories?
https://anengjipower.com/wp-content/uploads/2026/06/anengji-commercial-solar-plus-storage-benefits-site.webp
675
1000
Charging Station Engineer
https://anengjipower.com/wp-content/uploads/2025/09/anengji-dc-fast-charging-station-manufacturer-and-supplier-logo-white-1.png
Charging Station Engineer2026-06-20 14:34:102026-06-20 14:37:43What Are the Top Benefits of Solar Battery Storage in Factories? https://anengjipower.com/wp-content/uploads/2026/06/modular-commercial-solar-battery-storage-cabinet.webp
675
1000
Charging Station Engineer
https://anengjipower.com/wp-content/uploads/2025/09/anengji-dc-fast-charging-station-manufacturer-and-supplier-logo-white-1.png
Charging Station Engineer2026-06-18 09:16:522026-07-03 03:05:13What Is Solar Battery Storage? Complete C&I Engineering Guide
https://anengjipower.com/wp-content/uploads/2026/06/modular-commercial-solar-battery-storage-cabinet.webp
675
1000
Charging Station Engineer
https://anengjipower.com/wp-content/uploads/2025/09/anengji-dc-fast-charging-station-manufacturer-and-supplier-logo-white-1.png
Charging Station Engineer2026-06-18 09:16:522026-07-03 03:05:13What Is Solar Battery Storage? Complete C&I Engineering Guide


Leave a Reply
Want to join the discussion?Feel free to contribute!