Introduction
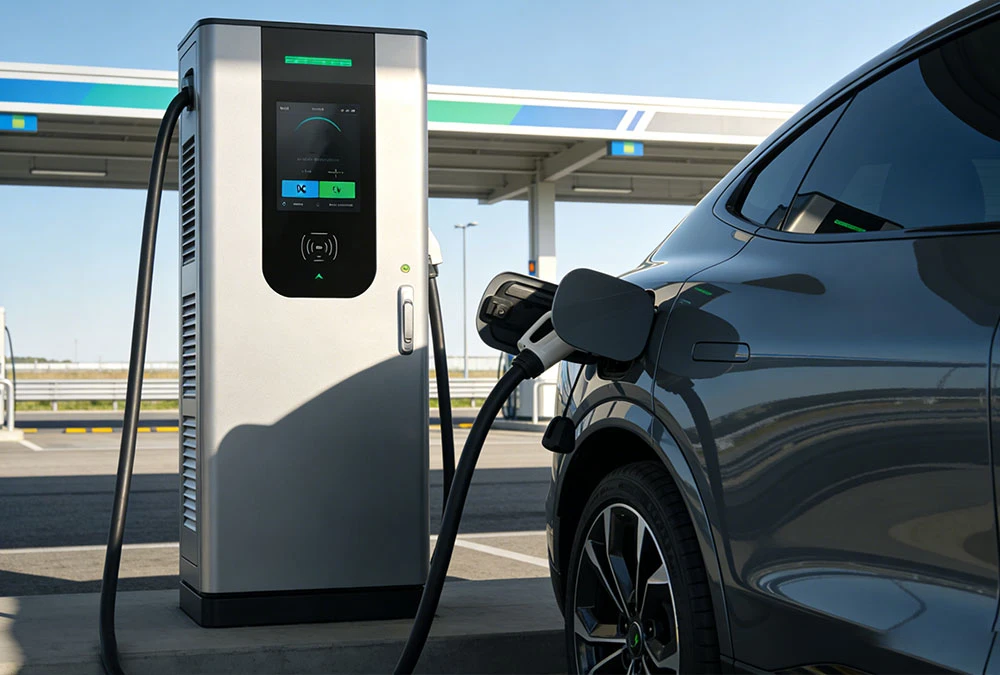
As of 2026, the global electric vehicle infrastructure has reached a pivotal level of maturity. According to the 2025 U.S. EV Fast Charging Report, over 18,000 new DC fast-charging ports were deployed in the last year alone, marking a 30% year-over-year increase. For commercial site hosts and fleet managers, the most frequent inquiry remains: what is the actual DC EV Charger charging time? While marketing materials often cite peak speeds, the reality of high-voltage charging is governed by complex variables including battery chemistry, thermal management, and grid interaction.
In this technical analysis, we break down the performance of Level 3 chargers under real-world commercial conditions, providing the data-driven insights necessary for optimizing site throughput and investment returns.
How Long Does a DC EV Charger (Level 3 Charger) Take to Charge an EV?
In a professional charging ecosystem, “speed” is a function of both the dispenser’s capacity and the vehicle’s acceptance rate. DC EV Charger charging time is the primary driver of the “turnover rate” for any commercial charging hub.
Typical Charging Time from 20% to 80% State of Charge (SOC)
The industry standard for measuring fast-charging performance is the 20% to 80% SOC window. This is because lithium-ion batteries can safely accept the highest current within this range.
- Standard 400V Vehicles: Using a 120kW charger, these vehicles typically require 22 to 30 minutes.
- Next-Gen 800V Vehicles: Vehicles utilizing 800V architecture (such as the Hyundai IONIQ 6 or Porsche Taycan) can complete this charge in 15 to 18 minutes at compatible ultra-fast stations.
60kW vs 120kW vs 180kW DC Fast Charger Time Comparison
Based on 2026 field data for a 77kWh battery pack, the following table illustrates the variance in duration:
| Charger Rating | 20% to 80% Time | Miles Added (15 min) | Optimal Use Case |
| 60kW DC | 48 – 55 Minutes | ~45 Miles | Urban Retail / Hotel Stays |
| 120kW DC | 24 – 30 Minutes | ~90 Miles | Public Hubs / Supermarkets |
| 180kW DC | 16 – 22 Minutes | ~135 Miles | Highway Rest Areas / Logistics |
| 360kW+ DC | 10 – 15 Minutes | ~200+ Miles | Ultra-Fast Transit Hubs |
Real-World Charging Duration vs Rated Power Output
A common misconception is that a 150kW charger delivers 150kW linearly. In practice, the average power delivery is often 20-30% lower than the peak due to the charging curve—the strategic ramping down of current as the battery fills to prevent electrolyte decomposition.
DC Fast Charger Charging Curve and Battery State of Charge (SOC)
To maximize the efficiency of a DC EV Charger charging time, operators must understand the “Mountain Profile” of the charging curve.
What Is a Charging Curve in DC Car Charger Systems?
The charging curve is the technical fingerprint of an EV. It represents how much power a battery can safely ingest at different percentages of fullness.
- Initial Phase (0-20% SOC): The BMS slowly ramps up power to warm the cells.
- Bulk Phase (20-60% SOC): The “sweet spot” where the station reaches its Peak Charging Power.
- Taper Phase (60-80% SOC): Power begins to descend to manage internal heat.
Why Charging Speed Drops After 80%
Once a battery hits 80%, it enters the “Constant Voltage” phase. Pushing high current into a nearly full battery can cause lithium plating, where lithium ions form metallic needles (dendrites) that can short-circuit the cell. For commercial sites, discouraging charging beyond 80% via pricing signals can improve stall availability.
Peak Charging Power vs Average Charging Power
A 180kW station might only hit its peak for 8 minutes. For financial modeling, CPOs (Charge Point Operators) should use Average Charging Power to estimate energy sales per hour.
Key Factors That Affect DC EV Charger Charging Speed
The efficiency of a DC EV Charger charging time is influenced by a synergy of vehicle hardware and environmental conditions.
Vehicle Voltage Platform (400V vs 800V Architecture)
The 800V platform is the 2026 benchmark for high-performance charging. By doubling the voltage, the system can deliver the same power at half the current, which drastically reduces resistive heat ($I^2R$ losses) in the cables and battery.
Battery Management System (BMS) Power Limitation
The BMS acts as the secondary controller. Under the ISO 15118-20 standard (mandatory for new EU public chargers as of 2026), the vehicle and charger engage in high-level communication. If the BMS detects cell temperature instability, it will request a lower current, overriding the charger’s maximum output.
Battery Temperature and Thermal Management System
Batteries are most efficient between 20°C and 45°C.
- Thermal Throttling: In extreme heat, the charger de-rates to prevent the battery from exceeding 60°C.
- Coldgate: In winter, internal resistance increases. Without pre-conditioning, a 150kW session might start at only 40kW.
Dynamic Power Allocation in Dual-Gun DC Fast Chargers
Most modern 120kW stations are modular. When two vehicles plug in, the station uses Dynamic Power Allocation to split the modules (e.g., 60kW each). This feature is essential for commercial sites to maximize the number of vehicles served, even if it slightly increases individual DC EV Charger charging time.
Grid Capacity and Transformer Constraints
Large-scale hubs often face grid limitations. If the local substation cannot handle the simultaneous draw of four 180kW units, the Smart Load Management software will cap the total site output, distributed based on each vehicle’s requested priority.
Why a 120kW DC Car Charger May Not Deliver 120kW in Practice
Technical discrepancies between rated and actual power are usually tied to hardware bottlenecks:
- Vehicle Acceptance Limits: Older EVs are capped at 50kW or 77kW.
- Cable Current Caps: A standard 200A air-cooled cable on a 400V car can only physically deliver 80kW ($400V \times 200A$).
- Harmonic Distortion: Poor power quality from the utility can cause the rectifier to reduce output to maintain safety standards.
How to Reduce Charging Time with the Right DC Fast Charging Station Setup
Selecting the Correct Power Level for Your Site
Matching the charger power to the user’s dwell time is vital. For retail parks where shoppers stay 60 minutes, a 60kW-90kW unit provides a full charge without the high cost of a 180kW ultra-fast unit.
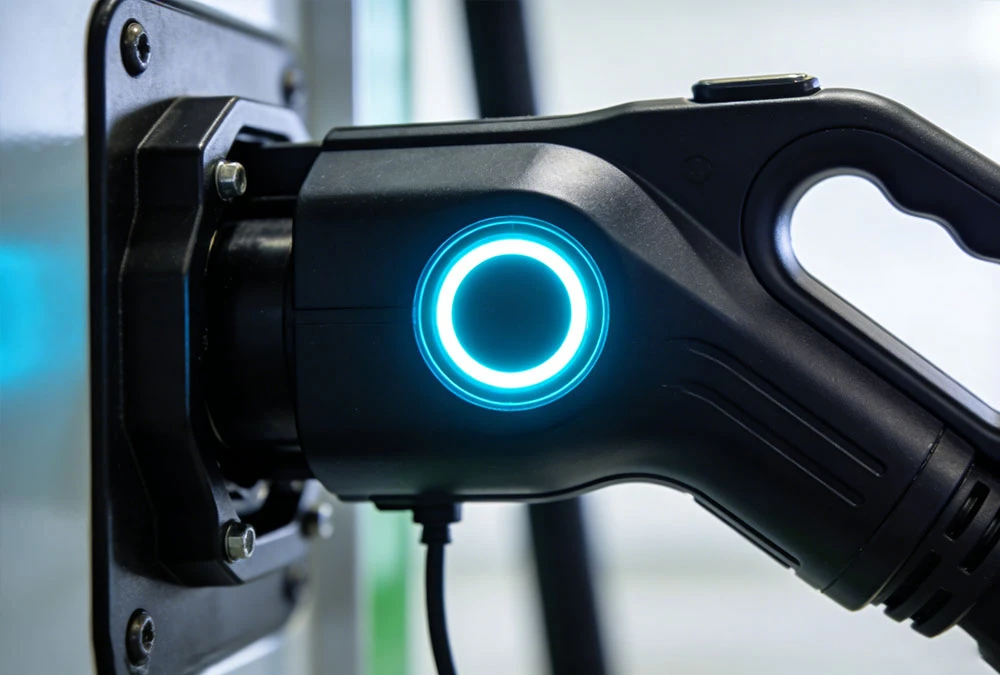
Using Liquid-Cooled Charging Cables
For ultra-fast charging (>200A), liquid-cooled charging cables are the 2026 industry standard. These cables utilize a coolant loop to dissipate heat, allowing for 500A+ continuous current. This ensures the DC EV Charger charging time remains ultra-low even during back-to-back high-power sessions.
Integrating Battery Energy Storage (BESS)
BESS Integration allows for “Peak Shaving.” The battery stores energy during low-demand periods and discharges it during peak EV charging events. This enables 180kW speeds even at sites with limited transformer capacity.
DC EV Charger Charging Time and Commercial Site Performance
Vehicle Dwell Time and Charger Utilization Rate
Success in commercial charging is measured by Utilization Rate. If the DC EV Charger charging time is too slow, you lose customers; if it is too fast (e.g., 10 minutes), the customer may leave before spending money at the adjacent retail outlet.
Charging Session Duration and Site Throughput
Site owners should calculate throughput using the following formula to determine ROI:
Choosing Power Levels Based on 2026 Charging Goals
| Location | Recommended Power | Duration Goal |
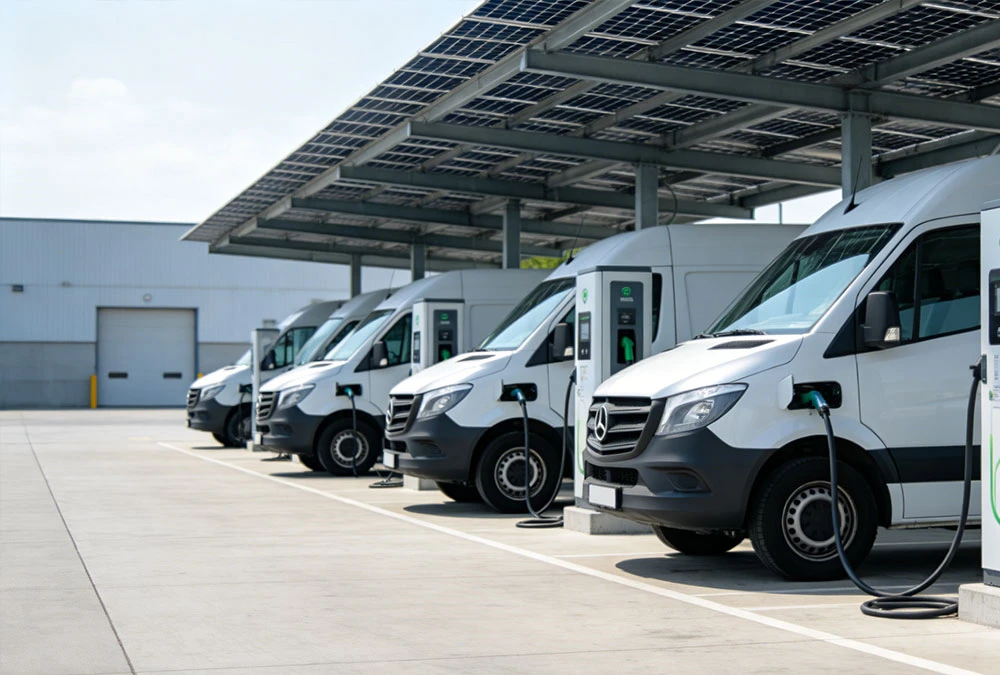
| Fleet Depots | 120kW – 180kW | 30 – 45 min (Mid-shift) |
| Retail/Dining | 60kW – 120kW | 45 – 60 min (Dwell time) |
| Highway Hubs | 240kW – 480kW | 10 – 15 min (Transit) |
| Workplace | 30kW – 60kW | 2 – 3 hours (Meetings) |
DC EV Charger FAQ (Optimized for Featured Snippets)
How long does a DC EV charger take to charge a car?
A DC EV charger typically takes 20 to 40 minutes to charge an electric car battery from 20% to 80%. The specific time depends on the charger’s power rating (kW), the vehicle’s battery size, and the battery’s state of charge (SOC) when the session begins.
Is a DC fast charger the same as a Level 3 charger?
Yes. In North America, DC fast charger and Level 3 charger are used interchangeably. Unlike Level 1 and Level 2, which provide AC power, Level 3 delivers high-voltage DC directly to the vehicle’s battery for significantly faster charging.
Why does charging slow down after 80% on a DC car charger?
Charging slows down after 80% to protect battery health and longevity. At high SOC levels, the risk of lithium plating and overheating increases. The vehicle’s BMS reduces the power intake to balance the cells safely.
Does a higher kW DC EV charger always mean faster charging?
Not always. Charging speed is limited by the vehicle’s maximum intake rate. If an EV can only accept 100kW, it will not charge faster on a 350kW station. Other factors like temperature and site-wide power sharing also impact speed.
What factors most affect DC EV charger charging time?
The four primary factors are:
- Battery SOC: Lower SOC allows for faster initial power intake.
- Temperature: Cold or extreme heat triggers power derating.
- Vehicle Voltage: 800V architectures charge faster than 400V systems.
- Site Capacity: Shared power between dual dispensers can limit output.
Conclusion: Driving ROI Through Technical Precision
Optimizing the DC EV Charger charging time requires a holistic engineering approach. From the selection of liquid-cooled cables to the implementation of OCPP-based smart load management, every component must be calibrated to the site’s specific traffic patterns. In 2026, the competitive edge for commercial hosts lies in providing consistent, high-speed power delivery that minimizes downtime and maximizes user throughput.
Would you like a detailed technical audit of your proposed charging site or a customized ROI projection based on local utility rates?
 https://anengjipower.com/wp-content/uploads/2026/03/commercial-lithium-ion-battery-energy-storage-system-container.jpg
675
1000
Charging Station Engineer
https://anengjipower.com/wp-content/uploads/2025/09/anengji-dc-fast-charging-station-manufacturer-and-supplier-logo-white-1.png
Charging Station Engineer2026-03-03 06:52:392026-03-03 06:54:00Lithium Ion Battery Energy Storage: 2026 Complete BESS Guide
https://anengjipower.com/wp-content/uploads/2026/03/commercial-lithium-ion-battery-energy-storage-system-container.jpg
675
1000
Charging Station Engineer
https://anengjipower.com/wp-content/uploads/2025/09/anengji-dc-fast-charging-station-manufacturer-and-supplier-logo-white-1.png
Charging Station Engineer2026-03-03 06:52:392026-03-03 06:54:00Lithium Ion Battery Energy Storage: 2026 Complete BESS Guide https://anengjipower.com/wp-content/uploads/2026/03/Industrial_Factory_With_BESS.webp
675
1000
Charging Station Engineer
https://anengjipower.com/wp-content/uploads/2025/09/anengji-dc-fast-charging-station-manufacturer-and-supplier-logo-white-1.png
Charging Station Engineer2026-03-02 03:40:252026-03-02 03:41:48What Is Energy Storage? The Ultimate Guide to ESS & BESS (2026)
https://anengjipower.com/wp-content/uploads/2026/03/Industrial_Factory_With_BESS.webp
675
1000
Charging Station Engineer
https://anengjipower.com/wp-content/uploads/2025/09/anengji-dc-fast-charging-station-manufacturer-and-supplier-logo-white-1.png
Charging Station Engineer2026-03-02 03:40:252026-03-02 03:41:48What Is Energy Storage? The Ultimate Guide to ESS & BESS (2026) https://anengjipower.com/wp-content/uploads/2026/02/commercial-battery-storage-peak-shaving.webp
675
1000
Charging Station Engineer
https://anengjipower.com/wp-content/uploads/2025/09/anengji-dc-fast-charging-station-manufacturer-and-supplier-logo-white-1.png
Charging Station Engineer2026-02-27 08:44:022026-02-27 08:45:11Battery Energy Storage System (BESS): Optimizing Clean Energy Transition
https://anengjipower.com/wp-content/uploads/2026/02/commercial-battery-storage-peak-shaving.webp
675
1000
Charging Station Engineer
https://anengjipower.com/wp-content/uploads/2025/09/anengji-dc-fast-charging-station-manufacturer-and-supplier-logo-white-1.png
Charging Station Engineer2026-02-27 08:44:022026-02-27 08:45:11Battery Energy Storage System (BESS): Optimizing Clean Energy Transition
Leave a Reply
Want to join the discussion?Feel free to contribute!