
Introduction
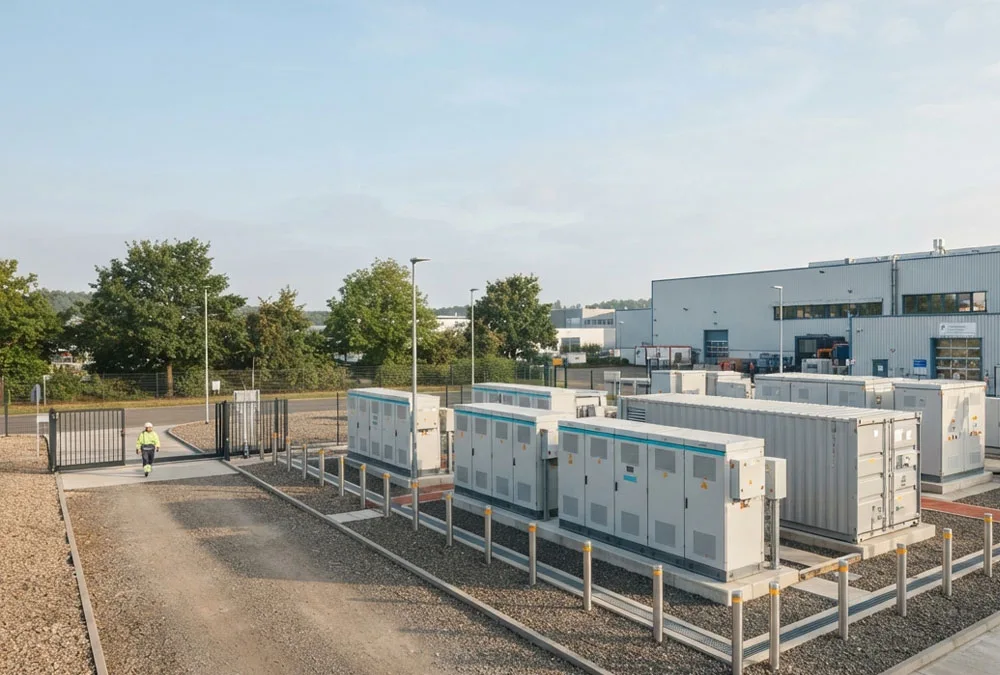
A battery can still charge, discharge and report a healthy state of charge while no longer finishing the job it was purchased to do. In the 2026 peer-reviewed study Investigating BESS Ageing from Operational Data on Electricity Markets, estimated available capacity in one market-operating BESS fell from approximately 9,600 kWh to 9,150 kWh across 23 months and 490 equivalent cycles—a modelled decline of 4.57%. That is a useful field example, but it is not a universal degradation rate. The study matters because it shows what owners actually need: consistent operational data, a defensible method and enough context to separate battery capacity fade from other causes of lost runtime.
For a factory, commercial building, solar developer or EPC, the practical question is rarely “Has the chemistry aged?” It is closer to this: Last year the BESS covered a 90-minute production peak; now it stops after 74 minutes, while the dashboard still shows 92% SOH. What changed? The useful answer must show whether the missing runtime comes from the battery, an unavailable rack, a revised SOC reserve, temperature derating, conversion losses or the way energy is being measured. Otherwise the site can miss the final minutes of a demand peak, lose backup runtime or enter a warranty discussion without evidence that both parties can reproduce.
23 months
Operational-data period in the 2026 study
490 FEC
Equivalent cycles recorded for the studied BESS
9.60 → 9.15 MWh
Estimated available-capacity change
4.57%
Modelled decline for this one system—not an industry average
The short answer
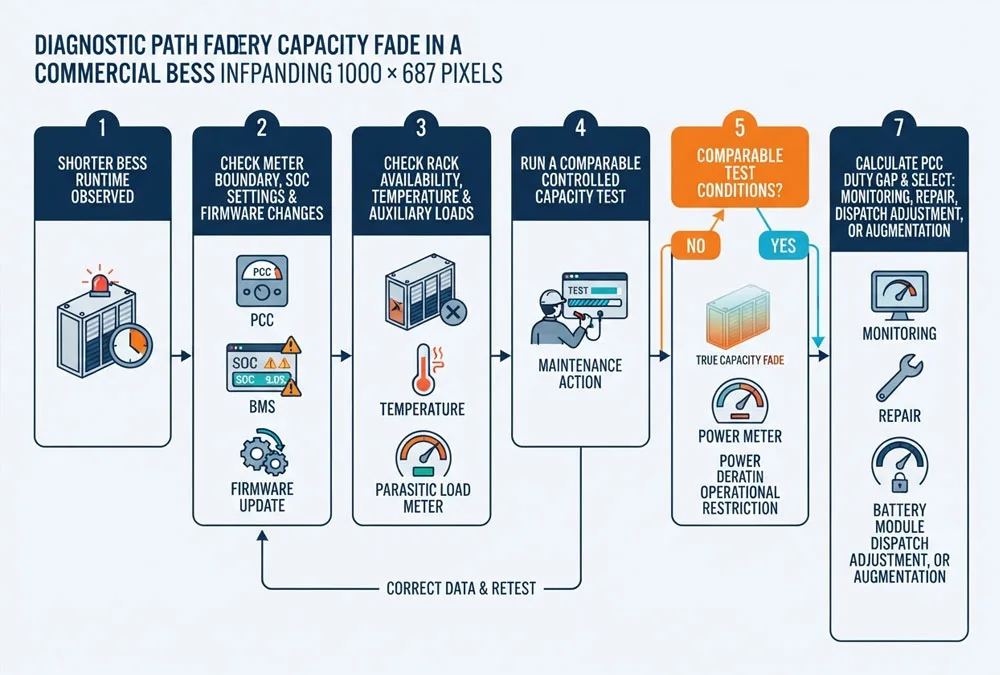
Battery capacity fade is the loss of energy a battery can store and deliver under comparable conditions. In a BESS, however, shorter runtime can also come from a changed SOC window, an unavailable rack, temperature derating, BMS estimation drift, higher auxiliary consumption or a different measurement boundary. Prove the loss under the same conditions before changing the operating strategy, making a warranty claim or buying more capacity.
Start With the Symptom
You do not need to begin with an electrochemistry diagnosis. Begin with what the operator can actually see in the EMS, BMS and revenue-meter data. The pattern below helps narrow the first investigation; it is not a substitute for the supplier’s approved diagnostic procedure.
| What the site sees | Check first | Why it matters | Next evidence |
|---|---|---|---|
| Runtime is shorter, but BMS SOH looks stable | SOC endpoints, reserve changes, offline racks and auxiliary loads | The battery may not have lost as much cell capacity as the runtime suggests | Compare DC and PCC energy for two matched events |
| One rack reaches its low-voltage limit early | Cell-voltage spread, rack SOC, current sharing and temperature | The weakest rack can terminate discharge while energy remains elsewhere | Rack-level trend export and balancing history |
| Available energy changes after a firmware or parameter update | Change log, SOC calibration and protection limits | A control change can look like sudden capacity loss or recovery | Repeat the approved test after settings are documented |
| Power derates before energy is exhausted | Temperature, resistance trend, voltage sag and PCS limits | This may be power fade or protection derating, not only capacity fade | Time-aligned BMS, PCS and meter records |
A practical rule: if the change appeared suddenly, first look for availability, settings, metering and temperature events. Electrochemical capacity fade usually develops as a trend. A sudden step can still reveal a real fault, but it deserves an event-based investigation before anyone applies a long-term degradation curve.
What Capacity Fade Means
Capacity Fade vs Power Fade
Capacity fade is an energy problem, normally expressed in kWh or MWh. Power fade is a capability problem, expressed in kW or MW. A battery may retain much of its energy capacity yet be unable to sustain the required power because resistance has increased or because voltage, temperature, PCS or BMS limits intervene. The opposite can also happen: the BESS may still reach the required MW but cannot hold it for the full dispatch window.
The European Commission Joint Research Centre’s 2024 report, Performance and Durability Requirements in the Batteries Regulation, treats capacity fade, power fade, internal-resistance increase and round-trip-efficiency fade as related but distinct durability parameters. Its selected cell datasets show why one metric cannot stand in for another: capacity fade could reach about 15% without an observed resistance increase, while resistance increase could reach 100% at only about 5% capacity fade. Those are not project benchmarks; they demonstrate that MWh retention alone cannot prove MW capability.
SOH vs Delivered Energy
State of health (SOH) is an estimate of remaining battery capability relative to a defined beginning-of-life reference. It is valuable, but the BMS number is not automatically the same as usable AC energy at the point of common coupling (PCC). Between the cells and the PCC sit operating reserves, DC conductors, contactors, the PCS, transformer, switchgear, cables and plant auxiliaries.
EPRI’s Understanding Usable Energy in Battery Energy Storage Systems separates inaccessible energy, safety and performance margins, degradation overbuild, DC/AC losses and delivered energy. For a buyer, this means that “90% SOH,” “90% retained DC capacity” and “90% of original net PCC energy” are three different statements. The site’s guide to battery capacity and usable energy explains those measurement boundaries in more detail.
What the Data Actually Shows
Capacity-fade numbers are useful only when the test object and conditions travel with the number. Three published datasets illustrate why a buyer should ask for the evidence behind a supplier’s headline cycle life instead of copying one percentage into a financial model.
1 operational BESS
23 months · 490 FEC · 4.57% modelled decline
The 2026 Energies study used real electricity-market operation and estimated a change from about 9.60 to 9.15 MWh. It proves that operational data can support a capacity trend; it does not establish a European fleet average.
21 German home systems
106 system-years · 14 billion data points
A 2024 Nature Energy field study followed privately operated systems for up to eight years and found an average usable-capacity decrease of roughly 2–3 percentage points per year. These were residential systems—not C&I BESS—and the study also found meaningful variation between systems.
12,103 cells + 552 batteries
Large library · incomplete comparability
The JRC compiled manufacturer and research data across chemistries and applications. It warned that cycle definitions and the method behind durability values are often unclear, so a large dataset still cannot remove test-boundary differences.
The German field study, Multi-year Field Measurements of Home Storage Systems and Their Use in Capacity Estimation, is especially useful for one operational lesson: software updates, SOC estimation, balancing energy, temperature and user-specific duty can affect the observed trend. Its 2–3 percentage-point annual average should therefore not be used as a C&I warranty assumption. Use it as evidence that long-term field estimation needs validation and that two nominally similar systems can age differently.
The JRC’s dataset makes the procurement problem even clearer. It included cells and batteries from different chemistries and applications, with disclosed test temperatures ranging from 15°C to 55°C in one source dataset. The report also notes that “number of cycles” is rarely defined clearly enough for direct comparison. For an EPC, the useful response is simple: ask every bidder for cycle definition, DoD, C-rate, temperature, SOC window, end-of-life criterion and whether the quoted result is a cell, rack or system value.
What these studies do—and do not—let you conclude
- They support: measuring a trend with consistent data, validating BMS estimates and keeping operating conditions with the result.
- They do not support: declaring that every LFP BESS loses a fixed percentage each year.
- For your project: use the supplier’s project-specific guarantee and an accepted field-test method, then compare actual duty delivery with that baseline.
Why BESS Capacity Fades
Calendar Ageing
Calendar ageing is degradation associated with time and storage conditions, even when the battery is not cycling. Temperature and the SOC at which the battery spends time influence the rate. This catches backup-focused owners by surprise: a system may complete very few deep cycles and still lose capacity while waiting at a high reserve.
The answer is not to apply one universal SOC setting. A backup obligation may require a high reserve, while a price-arbitrage project may have more freedom. The practical solution is to define the required reserve, avoid unnecessary high-SOC dwell where the duty allows, charge closer to the value window and remain within the manufacturer’s approved operating and warranty conditions.
Cycle Ageing
Cycle ageing is associated with energy throughput and the conditions under which charging and discharging occur. Depth of discharge (DoD), C-rate, SOC range, temperature and cell chemistry interact. Counting dispatch events is not enough. Four 25% SOC movements can represent approximately one full equivalent cycle (FEC), but the stress may differ from one continuous 100% swing because current, temperature and resting periods differ.
A common owner concern is whether daily operation is “using up” the battery too quickly. Avoiding all cycling is not automatically protective because calendar ageing continues and the asset may stop earning value. The better approach is degradation-aware dispatch: record charged and discharged energy, FEC, time at SOC, C-rate and temperature, then compare the economic value of each service with its effect on the warranty and future duty.
The JRC’s review of international durability standards shows how wide the test envelope can be: the assessed cycle-ageing tests used roughly 10–100% depth-of-discharge swing, C-rates from C/8 to 1C and about 0.5–4 FEC per day. This is not a recommended operating range for a particular BESS. It is evidence that two datasheets can both say “cycle life” while describing very different stress. If a quotation does not disclose the test conditions, the cycle number cannot be normalised with confidence.
Inside the Cell
At cell level, ageing can reduce the inventory of lithium available for reversible charge storage, reduce active electrode material and increase resistance. The result appears operationally as less storable energy, earlier voltage limits, more heat at a given current or reduced power capability. These mechanisms interact; the site operator normally diagnoses their system-level effects rather than trying to identify one electrochemical reaction from SCADA alone.
When It Is Not Fade
SOC Drift and Recalibration
SOC is estimated; it is not measured like voltage or current. This is especially challenging across the relatively flat middle portion of an LFP voltage curve. Small current-sensor offsets, shallow cycling and an incorrect capacity estimate can allow the calculated SOC to drift. A manufacturer-approved reference event or recalibration may change the displayed capacity or usable SOC range.
That apparent “capacity recovery” does not mean lost active material has regenerated. It may mean the BMS estimate has been corrected. Before claiming degradation, compare measured energy at a defined meter with the prior baseline and record whether firmware, SOC parameters or calibration logic changed.
Rack Limits and Auxiliaries
A system average can hide the rack that actually ends the discharge. EPRI explains that one cell, module or string may reach its SOC limit before the others, leaving part of the remaining energy unobtainable until balancing is restored. This is one of the details operators learn quickly in the field: the weakest rack can set plant runtime even when average SOH still looks respectable.
Unavailable racks create a different problem. If one of ten equal blocks is offline, the system has lost roughly 10% of installed block energy before any electrochemical fade is considered. Increased HVAC, pump or heater demand can then reduce net PCC energy further. A capacity review should therefore reconcile installed blocks, available blocks, DC energy, AC energy and auxiliaries rather than subtracting every loss from an SOH value that may already account for some of them.
Changed Test Conditions
A result at low power and moderate temperature does not prove performance during the site’s cold-morning start or hot-afternoon peak. The comparison also fails if the original test was measured at the DC bus while the new result comes from the PCC, or if the lower SOC reserve was changed from 10% to 20%.
Do not call it capacity fade until these match:
- electrical measurement boundary and calibrated meter;
- initial and final SOC or voltage conditions;
- discharge power, temperature and stabilisation method;
- available racks and treatment of interrupted data;
- auxiliary-energy treatment;
- firmware, parameter and reserve-setting changes.
Measure Capacity Correctly
Fix the Reference Boundary
Start with the contractual question. If revenue, demand reduction or backup performance is measured at the PCC, a DC-only result must be reconciled with PCS, transformer, cable and auxiliary effects. If the warranty is defined at the battery DC terminals, the test must still explain how that result maps to the owner’s AC duty.
The US Department of Energy Federal Energy Management Program’s Battery Energy Storage System Evaluation Method uses metered charging and discharging data to calculate demonstrated capacity and a normalised Capacity Ratio. It also documents data-quality limitations. The method is useful for structuring an assessment, but it is not EU law and it does not create a universal retirement threshold.
Run a Comparable Test
An approved field test should first confirm that the system is safe and available for the planned operation. Verify metering, time synchronisation, rack status and test abort criteria. Charge to the agreed upper condition, apply any specified rest or stabilisation period, then discharge at the defined power to the agreed lower condition. Record energy, power, voltage, current, SOC, temperature, alarms, auxiliaries and interruptions throughout the event.
Do not improvise beyond OEM limits to “see what is left.” A deep discharge outside the approved window can create safety and warranty problems while producing a result that the supplier is entitled to reject. If the result is anomalous, investigate the data and repeat only under the agreed procedure.
Read Rack Dispersion
Do not stop at one fleet-level SOH number. Review minimum and maximum cell voltage, rack SOC/SOH, current sharing, temperature spread, resistance trends, balancing activity, alarms and block availability. A widening spread may point to imbalance, sensing, cooling or a weak rack; it does not by itself prove a specific root cause. The purpose is to identify which evidence should be tested next.
Is your capacity result comparable?
Share the original test boundary, current meter data, SOC limits and rack availability. The first review should identify whether the result is comparable before recommending more battery capacity.
Calculate the Duty Gap
A percentage becomes useful when it is translated into the work the site can no longer complete. Use comparable measured energy at the same boundary:
Capacity retention (%) = current measured deliverable energy ÷ baseline deliverable energy × 100
Capacity fade (%) = 100% − capacity retention
Illustrative calculation—not an AnengJi product test or actual project result: a BESS delivered 1.80 MWh at the PCC during its accepted commissioning test. Under comparable conditions, it now delivers 1.62 MWh.
| Step | Calculation | Result | Decision meaning |
|---|---|---|---|
| Capacity retention | 1.62 ÷ 1.80 | 90% | Comparable delivered energy has fallen 10% |
| Required duty | 0.90 MW × 2.0 h | 1.80 MWh | The original duty uses the full accepted baseline |
| Energy shortfall | 1.80 − 1.62 | 0.18 MWh | The BESS cannot complete the original energy duty |
| Runtime shortfall | 0.18 MWh ÷ 0.90 MW | 0.20 h = 12 min | Check whether the missed 12 minutes falls inside the tariff, backup or market window |
This result does not say why the 0.18 MWh disappeared. It also does not prove that the battery should be replaced. If the real peak lasts only 75 minutes, the current capacity may still meet that service. If the site needs two verified hours of backup, the shortfall is material. The duty—not an arbitrary SOH threshold—sets the commercial decision.
Turn the Gap Into a Sizing Input
If testing confirms a real 0.18 MWh net PCC shortfall, do not order a 0.18 MWh battery block. The new block is rated on a different boundary and will not make every nameplate kWh available at the PCC. Convert the net duty gap back to rated DC energy using project-specific assumptions.
Required rated DC energy = net PCC gap ÷ (usable SOC fraction × one-way discharge efficiency × planning factor)
Illustrative assumptions only: 0.18 MWh ÷ (0.80 × 0.94 × 0.90) = approximately 0.266 MWh rated DC.
Here, 0.80 represents an assumed usable SOC fraction, 0.94 an assumed DC-to-PCC discharge efficiency and 0.90 an assumed planning factor for future degradation or availability. None is an AnengJi product guarantee or an industry average. Replace all three with approved project values. Then verify kW capability, duration, DC-voltage window, rack granularity, PCS headroom, thermal load, controls, fire strategy, land and warranty compatibility.
This is where a product page becomes a screening tool rather than a sizing result. A published 418 kWh liquid-cooled cabinet has more rated DC energy than the illustrative 0.266 MWh requirement, but that alone does not prove it can be added to the existing plant. The EPC must still confirm whether the cabinet, PCS and legacy battery can share the same electrical and control architecture safely.
Slow Capacity Fade
Control Temperature
Thermal management should control both temperature and uniformity. An acceptable enclosure average can hide hot racks, blocked heat-transfer paths, failed sensors or poor current sharing. Review rack-level temperatures during high-power charge and discharge, then maintain filters, fans, pumps, coolant circuits and control logic according to the selected system.
Do not accept “the container temperature was normal” as the end of the review. Ask for the hottest and coolest rack during the same dispatch, the duration of the spread and whether the cooling system was already at its control limit. If one rack repeatedly runs hotter and also reaches its voltage limit first, the combined pattern gives the service team a much better starting point than a fleet-average temperature. It still does not prove root cause; sensor accuracy, airflow or coolant distribution, current sharing and cell condition must be checked.
Manage SOC, DoD and C-Rate
A narrower SOC window can reduce stress, but it also reduces dispatchable energy. Lower power can reduce current stress, but it may fail the peak-shaving requirement. The control strategy must therefore optimise a real duty rather than follow a generic 20–80% rule copied from another battery.
- Define the minimum energy reserve required for backup or committed events.
- Avoid unnecessary high-SOC dwell when the operating objective permits.
- Keep charge/discharge power inside the supplier’s temperature- and SOC-dependent limits.
- Track cumulative charge and discharge energy, not event count alone.
- Reforecast future capacity after material changes to dispatch.
Plan Expansion Early
If the duty must remain constant for ten or fifteen years, the design needs a capacity strategy: initial overbuild, planned augmentation, progressive derating or a combination. EPRI identifies these as different ways to manage loss of deliverable energy. Each shifts cost and risk differently.
For utility-scale or large industrial projects, the published 5.015 MWh battery-container configuration is explicitly presented as a battery block without PCS or step-up transformer. That distinction matters when planning augmentation: a new battery block must fit the DC architecture, BMS hierarchy, PCS voltage/current window, protection, controls, land and warranty. Mixing new and aged blocks can change current sharing and the SOC limits reached first. “Add another container later” is not a complete augmentation plan.
Make Warranties Testable
Define the Guarantee Boundary
A promise such as “80% capacity after ten years” is incomplete. The contract should state whether that means cell, rack or system capacity; DC or AC energy; gross or net of auxiliaries; and beginning-of-life rated energy or accepted commissioning energy. It should also define SOC endpoints, power, temperature, rest time, meter class, unavailable-block treatment, tolerances and retest rights.
The World Bank/ESMAP report Warranties for Battery Energy Storage Systems in Developing Countries distinguishes restrictive, throughput-based and more adaptive performance-warranty approaches. Its central lesson applies beyond that geography: the owner must understand the operating boundaries that preserve coverage and how the warranty responds when actual use changes.
Define the Remedy
A testable guarantee still needs a commercial outcome. State whether a failed result triggers investigation, retest, repair, module replacement, augmentation, a revised guarantee or another agreed remedy. Define who pays for testing and downtime, which exclusions apply and who can access the raw data. Otherwise, a technically correct capacity result may not produce an enforceable solution.
EU Battery Data Rules
For Europe, Regulation (EU) 2023/1542 is directly relevant. Article 14 requires up-to-date data for the parameters used to determine state of health and expected lifetime to be contained in the BMS of stationary battery energy storage systems. Annex VII identifies the following SOH parameters for stationary BESS:
| Annex VII parameter | What it can reveal | What it cannot prove alone |
|---|---|---|
| Remaining capacity | Estimated energy retention | Net PCC energy under a specific duty |
| Remaining power capability, where possible | Present charge/discharge power capability | Performance at every SOC and temperature |
| Remaining RTE, where possible | Change in cycle efficiency | One-way discharge efficiency or auxiliary treatment |
| Self-discharge evolution | Change while the battery is at rest | Capacity under loaded operation |
| Ohmic resistance, where possible | A health signal related to voltage drop and power | A universal remaining-life prediction |
These data requirements improve transparency, but they do not replace the project’s capacity-test procedure or performance guarantee. An EPC should still specify export format, sampling, data retention, access rights and the method used to connect BMS estimates with the contractual meter.
Choose the Next Action
- The results are not comparable: correct the boundary, SOC endpoints, test power, temperature or data quality, then retest.
- The loss is operational: restore rack availability, correct parameters or calibration, and address cooling or auxiliary issues before declaring cell fade.
- True fade exists but duty is met: continue monitoring and update the capacity forecast against the warranty curve.
- A duty gap is emerging: adjust dispatch, review reserve strategy or engineer compatible augmentation before the obligation is missed.
- Duty, safety or economics no longer work: assess continue, repower, reuse or recycle options through a structured BESS lifecycle decision.
There is no universal “replace at 80%” answer. End of life is application-specific. A battery at 78% retention may still meet a reduced-duty application, while a system at 90% may already fail a tightly sized two-hour contract. Safety condition, power capability, warranty status and maintenance economics also belong in the decision.
Capacity Review Checklist
Before asking a supplier, EPC or independent engineer to assess battery capacity fade, prepare:
- commissioning and latest capacity-test reports;
- single-line diagram and exact measurement boundary;
- rated, usable and guaranteed energy definitions;
- original and current SOC endpoints and reserve rules;
- BMS SOH/SOC plus rack and cell dispersion exports;
- SCADA power/energy and revenue-meter data;
- temperature, cooling and auxiliary-energy records;
- rack/module unavailability history;
- firmware and parameter change log;
- cumulative throughput, FEC and exceptional events;
- warranty curve, exclusions, test method and remedy.
This pack is also useful before purchasing a new BESS. It forces each supplier to define how initial capacity, degradation reserve, thermal control, future augmentation and acceptance testing connect to the site’s real duty rather than a catalogue MWh value.
Battery Capacity Fade FAQs
What causes capacity fade in BESS?
Calendar time, temperature, SOC exposure, energy throughput, DoD, C-rate and chemistry all influence electrochemical ageing. At system level, imbalance, unavailable racks, auxiliary loads and control limits can also reduce delivered energy without being identical to cell capacity fade.
How is capacity fade calculated?
Under comparable conditions, divide current measured deliverable energy by the accepted baseline energy to calculate retention. Capacity fade is 100% minus retention. State the meter boundary, temperature, power, SOC endpoints and rack availability with the result.
Is capacity fade the same as degradation?
Capacity fade is one observable result of degradation. Degradation can also increase resistance, reduce power, change efficiency or increase self-discharge. A complete health assessment should not rely on capacity alone.
Does 80% SOH mean replacement?
No universal rule applies. Compare the system’s present deliverable energy and power with the required duty, safety condition, warranty, maintenance cost and future operating plan. The contractual threshold may trigger a remedy without automatically requiring full-system replacement.
Can recalibration restore capacity?
Recalibration can correct an SOC or capacity estimate and therefore change the displayed usable range. It does not reverse irreversible loss of lithium inventory or active material. Confirm the change with a measured, comparable energy test.
How often should capacity be tested?
Use the interval defined by the warranty, performance agreement, risk profile and duty. A continuous monitoring trend can flag change, while a formal test may be scheduled at commissioning, contractual milestones or when performance deviates materially. The same method and boundary matter more than an arbitrary universal interval.
Prove the Loss First
Battery capacity fade becomes manageable when the project uses one evidence chain: establish a baseline, repeat the measurement at the same boundary, separate cell ageing from configuration and availability effects, translate the change into a duty gap, then apply the warranty or operating response.
For an operating plant, that prevents a BMS estimate from becoming an unsupported warranty claim. For a new project, it prevents a headline MWh value from being mistaken for guaranteed lifetime delivery. In both cases, the result is a more defensible decision about dispatch, maintenance, augmentation and system sizing.
Need a Clear Capacity Review?
Share your baseline and current test data, duty profile, SOC window, temperature history and warranty conditions. An initial technical discussion can identify the missing evidence and the next sizing or configuration decision.

 https://anengjipower.com/wp-content/uploads/2026/06/epc-vs-turnkey-solar-project-bess.webp
675
1000
Charging Station Engineer
https://anengjipower.com/wp-content/uploads/2025/09/anengji-dc-fast-charging-station-manufacturer-and-supplier-logo-white-1.png
Charging Station Engineer2026-06-22 07:16:042026-06-24 07:13:17What Is the Difference Between EPC and Turnkey Contract Models in Energy Projects?
 https://anengjipower.com/wp-content/uploads/2026/06/anengji-commercial-solar-plus-storage-benefits-site.webp
675
1000
Charging Station Engineer
https://anengjipower.com/wp-content/uploads/2025/09/anengji-dc-fast-charging-station-manufacturer-and-supplier-logo-white-1.png
Charging Station Engineer2026-06-20 14:34:102026-06-20 14:37:43What Are the Top Benefits of Solar Battery Storage in Factories?
 https://anengjipower.com/wp-content/uploads/2026/06/modular-commercial-solar-battery-storage-cabinet.webp
675
1000
Charging Station Engineer
https://anengjipower.com/wp-content/uploads/2025/09/anengji-dc-fast-charging-station-manufacturer-and-supplier-logo-white-1.png
Charging Station Engineer2026-06-18 09:16:522026-07-03 03:05:13What Is Solar Battery Storage? Complete C&I Engineering Guide


Leave a Reply
Want to join the discussion?Feel free to contribute!