
Introduction
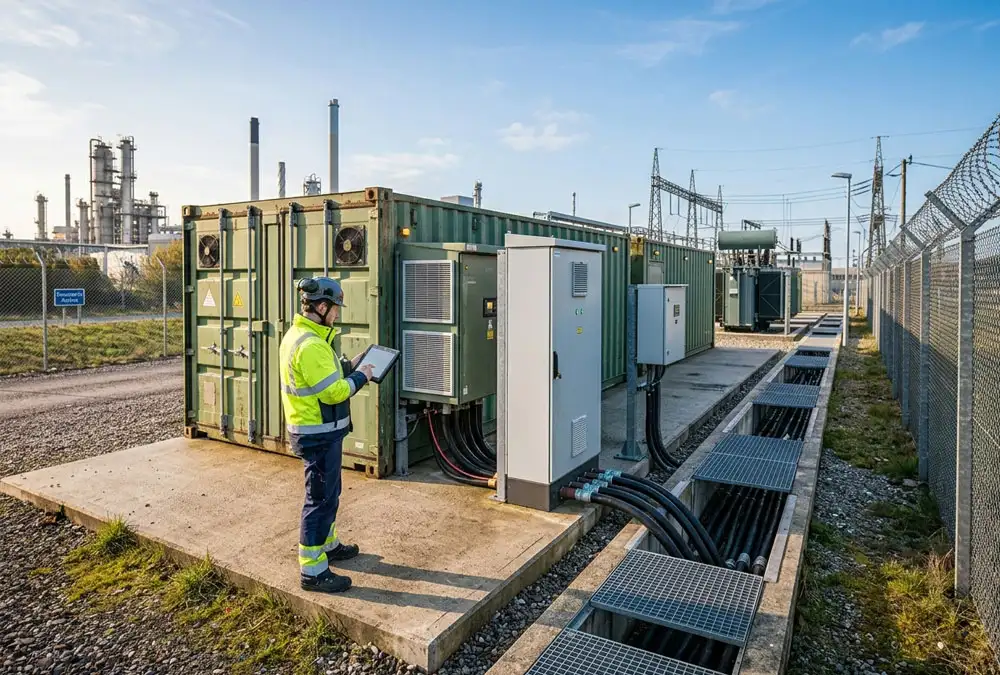
5MWh BESS cost figures can differ by more than the battery technology alone can explain. One quotation may cover a liquid-cooled DC container at a Chinese port. Another may include the power conversion system (PCS), medium-voltage transformer and delivery to Europe. A third may represent an installed, commissioned asset with civil works, grid studies and performance testing. Dividing each total by 5,000 kWh produces three precise-looking numbers that are not commercially comparable.
That distinction matters in a rapidly expanding market. SolarPower Europe reported in its June 2026 release for the European Battery Market Outlook 2026–2030 that Europe installed 36 GWh during 2025, 48% more than in 2024, and passed 100 GWh of operating capacity. Its market definition covers the EU-27 plus the UK, Switzerland, Ukraine and Türkiye. The same release says utility-scale storage supplied more than half of annual additions for the first time. Read the dated figures and geographic note in the SolarPower Europe market release.
For developers, EPC companies and industrial buyers, faster deployment does not make budgeting easier. Higher-density battery blocks can reduce container count, yet grid upgrades, national compliance, fire engineering, transport, foundations and long-term guarantees remain project-specific. A low equipment quote can therefore create an expensive board-level problem: the investment is approved on a narrow scope, and the missing costs appear after the selected design has already constrained the site.
The key budgeting rule: never compare a price until its date, currency, Incoterms, MW rating, energy boundary, delivery location and included scope are known.
This guide separates DC-block cost from AC/MV equipment and the complete installed project, then shows how to normalise competing offers on guaranteed usable energy rather than brochure nameplate alone.
What Does a 5 MWh Battery Storage Quote Actually Include?
Five megawatt-hours is an energy rating. It does not specify project power. A nominal 1.25 MW/5 MWh design has a four-hour energy-to-power ratio; 2.5 MW/5 MWh is two hours; 5 MW/5 MWh is one hour. These configurations can use the same nominal energy while requiring different PCS capacity, transformer MVA, switchgear, cable sizing, thermal performance and grid rights. Asking only for “a 5 MWh price” leaves the supplier to choose the power architecture and makes the resulting bids difficult to compare.
Energy boundaries create a second ambiguity. A 5 MWh label may describe gross DC energy stored in the cells, usable DC energy inside the permitted state-of-charge window, usable AC energy after conversion, or net energy delivered at the point of connection (PCC). Transformer and cable losses may sit between the PCS and PCC. Cooling pumps, fans, controls, fire systems and communications also consume energy. Degradation then changes the deliverable quantity over time.
| Quoted denominator | What it may represent | Typical missing deductions | Buyer consequence |
|---|---|---|---|
| €/nominal DC kWh | Gross beginning-of-life battery nameplate | SOC reserve, conversion losses, auxiliaries and ageing | Usually produces the lowest-looking ratio |
| €/usable DC kWh | Energy inside the permitted battery operating window | PCS, transformer, cable and auxiliary losses | Better battery comparison, but not yet a PCC value |
| €/usable AC kWh | Energy after the PCS at a stated test boundary | MV losses, external auxiliaries and site constraints | Useful only when the meter location is explicit |
| €/guaranteed PCC kWh | Contracted net energy at the project connection point | Only exclusions expressly written into the test method | Best basis for comparing ability to deliver the required service |
The practical solution is a boundary schedule. Require every bidder to state nominal and usable energy at beginning of life (BOL), the guaranteed value at the contractual end-of-life (EOL) point, the measurement meter, the reference temperature and power, and whether auxiliary consumption is included. The site’s European BESS design guide explains these technical boundaries in greater depth.
Current 5MWh Battery Storage Cost Benchmarks in Europe
There is no single authoritative European 5 MWh project price. Available publications measure different products, years and scopes. They are still useful when the boundary is preserved.
Figure 9.3 and the accompanying text on page 182 of IRENA’s Renewable Power Generation Costs in 2024 report global weighted-average turnkey storage-system prices of USD 165/kWh to USD 148/kWh in 2024, depending on duration. Crucially, the same passage defines these figures as including battery providers and system integrators while excluding EPC, grid connection and development costs. It also shows market and duration differences, so the figures are neither a Europe-specific installed budget nor a 5 MWh quotation. See page 182 and Figure 9.3 in the IRENA 2024 cost report.
IRENA’s later 24/7 Renewables: The Economics of Firm Solar and Wind states in Table 4 on pages 35–36 that global volume-weighted average turnkey energy-storage system prices fell below USD 120/kWh in 2025. It also reports that European and US costs remained roughly two-and-a-half to three times Chinese costs, attributing the gap to localisation, tariff exposure and supply-chain constraints. These are broad market findings based partly on BloombergNEF data, not a promise that a project can be commissioned at that unit price. Page 57 separately defines the BESS scope used for Table 10 as including racks, balance of system, EMS, PCS, transformer, installation and commissioning—an example of why the table definition must travel with the number. Review Table 4 and the methodology note in the IRENA 2026 report.
A commercial European reference illustrates the other end of the scope. PVB’s June 2026 buyer guide publishes an indicative range of €270–450/kWh for 5 MWh-plus C&I projects under a “total installed cost” heading. Multiplying that vendor-published planning range by 5,000 kWh gives €1.35 million to €2.25 million. The page says the spread depends on grid upgrades, fire layout, MV integration and project complexity. This is a supplier-side budget indication, not an independent price index or a quotation for a specific site; use it only after checking its inclusions against the project. See the “Typical C&I BESS Total Installed Cost Ranges in Europe” table in the PVB European cost guide.
| Published reference | Date/geography | Reported value | Boundary warning | Buyer use |
|---|---|---|---|---|
| IRENA Figure 9.3 | 2024, global and major markets | USD 148–165/kWh global weighted-average turnkey range by duration | Excludes EPC, grid connection and development | Historical equipment/integration benchmark |
| IRENA Table 4 | 2025, global with regional comparison | Below USD 120/kWh global turnkey average | Not a 5 MWh European installed-project price | Direction of market and regional divergence |
| PVB commercial guide | June 2026, European C&I | €270–450/kWh for 5 MWh-plus installed projects | Vendor-published indication; site scope varies | Early planning envelope, not procurement approval |
Do not average these rows. They use different years, currencies, geographic populations and cost boundaries. A useful benchmark preserves those differences; a misleading benchmark hides them.
DC Block vs Installed Project: The 5MWh Cost Boundary Ladder
The Cost Boundary Ladder is a practical way to identify what a quote buys. Each level adds equipment, project work or risk that may sit outside the previous price.
| Level | Usually included | Common exclusions | Evidence to request | Buyer benefit |
|---|---|---|---|---|
| 1. Cell/pack reference | Cells or assembled packs | Container, BMS, cooling, PCS and all site work | Chemistry, format, test conditions and volume | Tracks supply-chain direction only |
| 2. DC block | Racks, BMS, DC protection, cooling, enclosure and container safety | PCS, transformer, MV switchgear and EPC | Signed datasheet, GA, DC SLD and energy guarantee | Compares battery equipment on a defined boundary |
| 3. AC block | DC block plus PCS and local controls | MV equipment, external auxiliaries, grid studies and civils | PCS capability curve, efficiency boundary and interface list | Clarifies power and conversion cost |
| 4. MV block | Battery, PCS, transformer, MV switchgear and factory integration | External protection, owner SCADA, grid studies and construction | Factory test plan, SLD and responsibility matrix | Reduces field interfaces without claiming a completed project |
| 5. Delivered system | Specified equipment plus contracted freight and delivery | Unloading, crane, duties, site installation or commissioning unless stated | Incoterms, named place, insurance and delivery schedule | Exposes landed-cost responsibility |
| 6. Installed project | Contracted equipment, civil/electrical works, integration and commissioning | Land, finance, tax, external reinforcement or long-term service may remain separate | BOQ, exclusions, test procedure and final acceptance boundary | Closest figure to the investment approval need |
A real DC-block example from this site
The published 5MWh liquid-cooled battery container provides a useful scope example. Its page lists 5.015 MWh nominal DC energy, 314 Ah LFP cells, a nominal 1,331 Vdc bus, a stated 1,165–1,498 Vdc range, 0.5C operation, liquid cooling and a 45-tonne system weight. Most importantly for cost comparison, the page identifies the product as a pure DC battery container and states that the PCS and transformer are excluded.
Those values are vendor-published product information, not a complete project specification. Before using the product in a budget, obtain the current signed datasheet, general-arrangement drawing, voltage and current limits, temperature-derating curves, auxiliary-load schedule, warranty, transport plan and project-specific compliance file. A public product page can establish the preliminary boundary; only the contracted documents establish what the project will receive.
How to Build a 5MWh Battery Storage Project Budget
A transparent budget separates costs that scale with energy, costs that scale with power, and costs that remain largely fixed for the site. The US National Renewable Energy Laboratory uses the same core logic in the “Total Battery System Cost” equations of its 2024b Annual Technology Baseline: storage capacity is multiplied by an energy cost, while power capacity is multiplied by a power cost and combined with a constant component. NREL’s model is not a European price list, but the structure is useful. See the equations on the NREL ATB methodology page.
Installed CAPEX = (energy-side €/kWh × 5,000 kWh) + (power-side €/kW × selected kW) + fixed site/grid cost + lifecycle allowance
This is a normalisation formula. The unit rates must come from dated quotations for the actual country, site and delivery scope.
Cost sensitivity before a supplier price is known
| Illustrative change | Calculation | Budget movement | Decision meaning |
|---|---|---|---|
| Energy-side rate changes by €10/kWh | €10 × 5,000 kWh | €50,000 | Verify that the cheaper rate uses the same energy and warranty boundary |
| Power-side rate changes by €25/kW on 2.5 MW | €25 × 2,500 kW | €62,500 | PCS and MV scope should not be hidden inside a single €/kWh value |
| Grid or civil scope rises by €100,000 | €100,000 ÷ 5,000 kWh | €20/kWh | Fixed site costs materially affect a single-block project |
| Usable PCC energy is 4,140 rather than 5,000 kWh | 5,000 ÷ 4,140 | Effective cost per delivered kWh is 20.8% higher | Normalise to guaranteed energy, not nameplate |
The last row is mathematical, not a claim that every battery delivers 4,140 kWh. It illustrates the effect of an assumed 90% usable SOC window and 92% one-way discharge path: 5,000 × 0.90 × 0.92 = 4,140 kWh before any separately treated fixed auxiliary energy. A bidder may guarantee a different value, but that value must be stated and tested.
Why 1.25 MW, 2.5 MW and 5 MW do not cost the same
| Nominal configuration | Energy-to-power ratio | Cost areas most affected | Buyer benefit and limitation |
|---|---|---|---|
| 1.25 MW / 5 MWh | 4 hours | Lower PCS/MV power, longer discharge window | Potentially lower power-side cost; unsuitable if higher instantaneous power is required |
| 2.5 MW / 5 MWh | 2 hours | Balanced PCS, transformer, cables and thermal duty | Common conceptual pairing, but not automatically two hours at the PCC |
| 5 MW / 5 MWh | 1 hour | Higher PCS/MVA, current, cable, cooling and connection demand | Higher instantaneous output if the battery and warranty permit it |
Selecting the smallest PCS to reduce CAPEX can destroy project value if the load peak or market service needs more MW. Selecting the largest PCS can waste capital or exceed the connection right. The correct sequence is to model the dispatch requirement, connection constraint and thermal envelope, then price the resulting power train. Use the site’s BESS sizing guide to prepare the load, generation and duty-cycle inputs.
Need a budget that uses your boundary? Send the project country, required MW, duration, grid voltage, import/export limit, site type and target operating date. These inputs allow a preliminary DC, AC/MV and installed-scope comparison.
What Drives the Installed Cost of a 5MWh Battery System?
Power conversion and medium voltage
The PCS must match the battery’s DC voltage window and current limits while delivering the required active and reactive power across temperature and grid-voltage conditions. The transformer and switchgear then have to match the connection voltage, MVA duty, fault level and protection philosophy. A budget that adds a generic PCS percentage to a DC price can miss reactive-power headroom, redundancy, harmonics, grid-forming functions or local certification.
Transport, Incoterms and lifting
Freight is not a fixed adder. ESS News, citing InfoLink’s weekly tracking, reported that port-to-port logistics for a 5 MWh two-hour DC container delivered to Rotterdam increased from roughly USD 1.1–1.4/kWh at the end of 2025 to USD 1.5–1.9/kWh in June 2026. The article labels these as logistics figures, not equipment or installed prices. See the “Freight costs rise” passage in the ESS News and InfoLink market analysis.
Port-to-port freight still omits inland abnormal transport, terminal handling, storage, insurance, customs responsibility, crane mobilisation and foundations. A 45-tonne container may reduce equipment count while requiring early route and lifting studies. State the named place and Incoterms in every quotation, then assign unloading and import risk explicitly.
Civil works, fire design and noise
An equipment layout is not a construction layout. Installed cost may include ground improvement, concrete pads, drainage, oil containment for transformers, cable trenches, earthing, fencing, emergency access, separation distances, water supply, acoustic barriers and replacement routes. A retrofit industrial site can be more expensive than a greenfield plot when live electrical interfaces, short shutdown windows and restricted crane access dominate the work.
The buyer’s recurring problem is discovering these requirements after the equipment arrangement is frozen. The consequence is redesign, planning delay or a lost connection milestone. Commission a concept layout and fire-risk review before ordering the container, and include a site-specific responsibility matrix in the tender rather than asking the battery manufacturer to absorb unknown local works.
Controls, communications and acceptance
The BMS protects the cells and publishes available limits; the PCS converts power; the EMS schedules operation; and a plant controller may regulate the entire project at the PCC. The installed price must identify who supplies the plant controller, SCADA gateway, network-operator interface, revenue meter, time synchronisation, cybersecurity configuration and optimiser integration. Testing must cover alarms, trips, active and reactive power, export limitation and the contractual energy/efficiency method.
Why European 5MWh Storage Costs Vary by Country
Europe is not one installed-cost jurisdiction. EU legislation and EN/IEC standards create common elements, but network operators, planning systems, fire authorities, labour markets, transport routes and taxes remain national or local. The UK must be evaluated separately from the EU-27.
| Market | Connection-cost driver | Safety/planning consideration | Budget action | Buyer benefit |
|---|---|---|---|---|
| Germany | Voltage-level-specific Technical Connection Rules, modelling and operator requirements | State and local permitting/fire pathway remains site-specific | Price certification, studies and witness testing as named scope | Avoids assuming that a generic IEC file completes German connection compliance |
| Great Britain | DNO/ transmission process, G99 export requirements and possible export limitation | Planning and fire engagement follow British institutions, not EU member-state procedures | Separate import, export, planning and safety work packages | Prevents an EU-27 assumption from understating British delivery work |
| Netherlands | ESM documentation, models, testing and constrained network capacity | PGS 37-1 provides a risk-based framework for lithium energy-storage systems | Budget compliance documents, site measures and connection constraints early | Reduces redesign between equipment selection and permit review |
| Spain | Access and connection procedure, requested capacity and milestone obligations | Network permission does not replace environmental, construction or municipal approval | Treat guarantees and connection milestones as development risk | Avoids pricing hardware before project identity and connection rights are stable |
| Italy | TSO or DSO connection route and applicable technical package | Market qualification is separate from connection and construction approval | Separate electrical connection, civil approval and revenue qualification budgets | Stops market-access assumptions from being hidden in the EPC price |
The technical distinctions in the table come from national industry and system-operator materials. VDE FNN’s “Nationwide Network Connection Rules for Energy Storage Systems” explains that German storage requirements are organised through voltage-level-specific Technical Connection Rules; see the VDE FNN storage connection overview. The UK Energy Networks Association states that G98 and G99 form the technical connection route developed for storage devices; see the ENA energy-storage connection page. Netbeheer Nederland’s ESM Compliance Verification Document defines the Dutch operational-notification, technical-data, testing and simulation evidence path for new storage modules; see the Dutch ESM verification document. Terna states that Italian transmission connection is governed through ARERA resolutions incorporated into its Grid Code; see the Terna connection-planning explanation.
For example, the Dutch PGS 37-1:2023 version 1.1 published in April 2026 describes a risk-based safety approach with scenarios, objectives and measures for lithium-containing energy-storage systems. This affects layout and mitigation discussions but does not create a universal Europe-wide installed price. Review the purpose, scope and risk approach in the official PGS 37-1 publication. Spain’s consolidated Royal Decree 1183/2020 separately sets the access and connection framework and shows amendments through March 2026, reinforcing the need to check the current national text rather than rely on an old generic checklist. See the index and update record in the official Spanish BOE publication.
Country differences should not be converted into unsupported national €/kWh premiums. The correct approach is to obtain the connection offer, planning route, fire strategy and site quantities, then price the identified work. The site’s BESS grid connection guide provides a practical list of project inputs.
European vs US Costs for a 5MWh Battery Project
The United States is useful as a secondary benchmark, but its project costs cannot be pasted into a European model. US projects combine federal incentives and trade rules with state, utility, ISO/RTO and authority-having-jurisdiction requirements. European projects combine EU legislation and standards with national network and local approval routes. The safety evidence, tax treatment, labour cost, grid process and localisation exposure are different.
The IEA’s Global EV Outlook 2026 provides one supply-chain comparison: in the “Battery prices continued to decrease, albeit unevenly” section, it reports that 2025 battery-pack prices in China were 30% below North America and 35% below Europe. Its notes say the regional averages cover EV and battery-storage applications, so they are not installed BESS project prices. This distinction is precisely why pack-price headlines should not become EPC budgets. See the regional price discussion and chart notes in the IEA battery analysis.
| Comparison point | Europe | United States | Buyer implication |
|---|---|---|---|
| Technical/safety route | EU law, IEC/EN standards, national grid rules and local approvals | UL/NFPA/code framework plus utility and AHJ requirements | Certification budgets and documents are not interchangeable |
| Cost model | EUR equipment, logistics, national EPC and grid scope | USD power/energy costs with US taxes, incentives and labour | Use the methodology across markets, not the raw unit rate |
| Project variance | Country, DSO/TSO, land and permitting differences | State, ISO/RTO, utility and AHJ differences | A regional average never replaces a site quotation |
Lifecycle Costs Beyond the Initial 5MWh Battery Price
Degradation and augmentation
A 5 MWh BOL nameplate does not establish the year-ten deliverable capacity. The owner must decide whether to install extra energy at COD, accept a falling service duration, or add capacity later. Each strategy changes CAPEX, footprint, cable and protection capacity, commissioning work and technology-compatibility risk. If the revenue model assumes constant energy while the tender allows declining capacity, the apparent low price transfers performance risk to the owner.
Warranty conditions and operating freedom
Capacity and availability guarantees depend on defined operating conditions. Check annual throughput, equivalent full cycles, SOC window, charge/discharge power, ambient temperature, downtime exclusions and maintenance duties. A less expensive warranty may permit fewer cycles or narrower operation than the optimiser assumes. Connect the commercial dispatch model to the warranty model before comparing net present value.
Service, auxiliaries and replacement
Long-term cost can include cooling-system service, filters, pumps, fans, sensors, contactors, PCS parts, software licences, cybersecurity updates, remote monitoring, emergency response and periodic capacity testing. Auxiliary electricity has both a technical and financial effect: it reduces net energy and must be purchased or deducted from revenue. Require normal, peak, standby and cold-start auxiliary values rather than one undefined percentage.
How to Compare 5MWh BESS Supplier Quotes
A common bid form is more useful than collecting three polished proposals. Require each bidder to complete the same fields and attach evidence for every guarantee.
| Comparison field | Required entry | Evidence | Red flag | Buyer benefit |
|---|---|---|---|---|
| Commercial basis | Date, currency, validity, Incoterms and named place | Signed quotation | “Delivered Europe” with no location or importer | Controls exchange, freight and delivery risk |
| Energy | Nominal DC, usable DC, usable AC/PCC at BOL and EOL | Datasheet, warranty and test method | One “5 MWh” number with no boundary | Enables €/guaranteed usable kWh comparison |
| Power | Continuous MW/MVA, overload and reactive capability | PCS curves and derating data | Power stated only at ideal voltage/temperature | Confirms service and grid suitability |
| Installed scope | PCS, MV, civils, cables, studies, SCADA and commissioning | BOQ, SLD and responsibility matrix | “Turnkey” with long unstated exclusions | Reduces change-order exposure |
| Lifecycle | Throughput, service, spares, availability and augmentation | Warranty model and LTSA | Cycle life without DoD, temperature or EOL threshold | Aligns operating model with contractual protection |
Supplier selection should also consider reference-system similarity, manufacturing capacity, European service coverage, software/data access, bankability and responsibility for integration. The lowest equipment price is not the lowest project risk. The site’s BESS EPC contractor selection guide adds delivery and contract questions to the comparison.
Inputs Needed for an Accurate 5MWh BESS Price
A supplier cannot produce a defensible installed-project price from energy capacity alone. A useful request should include:
- Project country, site address and whether the site is greenfield or retrofit.
- Application, dispatch profile and required annual throughput.
- Required MW, MWh, duration and response time.
- Grid voltage, import/export limits and available fault-level information.
- Nominal, BOL usable and EOL guaranteed energy requirements.
- Ambient temperature, altitude, acoustic limit and available footprint.
- Required delivery boundary: DC block, AC block, MV block or installed project.
- Applicable planning, fire, insurer and network-operator requirements.
- Incoterms, delivery location, target COD and required schedule.
- Service response, spares, warranty, availability and augmentation expectations.
If several inputs remain unknown, request a staged budget with explicit allowances and exclusions rather than a false fixed price. That preserves decision value while the connection and site design mature.
5MWh Battery Storage Cost FAQs
How much does a 5MWh BESS cost in Europe?
The answer depends on whether the price covers a DC container, AC or MV equipment, delivered equipment, or a fully installed project. A June 2026 vendor guide published €270–450/kWh for 5 MWh-plus European C&I installed projects, equivalent to €1.35–2.25 million for 5,000 kWh, but this is an indicative commercial range rather than an independent market index. A project-specific price requires MW, country, connection, site, warranty and scope inputs.
Is a 5 MWh battery container a complete project?
Not necessarily. A DC container commonly excludes the PCS, transformer, switchgear, external controls, grid studies, civil works, cables, installation and commissioning. Read the supplier’s inclusions and exclusions rather than relying on “system” or “turnkey” in the title.
How should cost per usable kWh be calculated?
Divide the comparable project cost by the guaranteed usable energy at the agreed boundary and date. For example, use BOL PCC energy for COD comparison or EOL PCC energy when the commercial obligation applies in a future year. Do not divide one bid by nominal DC capacity and another by usable AC capacity.
Does 5 MWh automatically provide two hours of storage?
No. Two hours is the nominal ratio when 5 MWh is paired with 2.5 MW. Actual net duration depends on usable SOC, losses, auxiliaries, power limits, temperature and degradation.
Why is a European installed project more expensive than an Asian factory quote?
The factory quote may stop at a DC container or port. The European project can add freight, insurance, import responsibilities, PCS, MV equipment, local engineering, grid studies, foundations, cabling, fire and acoustic measures, installation, commissioning, warranty support and tax.
Should quotations be compared at BOL or EOL?
Use both when the asset has a long-term service obligation. BOL shows the initial commissioned capability; EOL shows what the owner is contractually protected to receive after ageing. State whether augmentation is included.
Conclusion: Compare 5MWh BESS Scope Before Price
A credible 5MWh BESS cost assessment starts by defining what 5 MWh means, how many MW the project must deliver, where energy is measured and which equipment and project activities are included. DC-block prices are useful for battery procurement. AC and MV prices are useful for system architecture. Only a clearly scoped installed-project budget supports investment approval.
For Europe, preserve country, network operator, site, delivery date and regulatory route. For the United States or another market, reuse the power-plus-energy cost logic but replace the local compliance, trade, tax and construction assumptions. In every market, compare total cost and €/guaranteed usable PCC kWh on the same boundary, then connect the result to the warranty and lifecycle plan.
Request a Scope-Normalised 5MWh BESS Cost Review
Share the project country, MW/MWh requirement, operating objective, grid voltage, connection limits, site condition, delivery boundary and target COD. The review can identify the appropriate DC, AC/MV and installed-project scope before supplier prices are compared.
 https://anengjipower.com/wp-content/uploads/2026/06/epc-vs-turnkey-solar-project-bess.webp
675
1000
Charging Station Engineer
https://anengjipower.com/wp-content/uploads/2025/09/anengji-dc-fast-charging-station-manufacturer-and-supplier-logo-white-1.png
Charging Station Engineer2026-06-22 07:16:042026-06-24 07:13:17What Is the Difference Between EPC and Turnkey Contract Models in Energy Projects?
https://anengjipower.com/wp-content/uploads/2026/06/epc-vs-turnkey-solar-project-bess.webp
675
1000
Charging Station Engineer
https://anengjipower.com/wp-content/uploads/2025/09/anengji-dc-fast-charging-station-manufacturer-and-supplier-logo-white-1.png
Charging Station Engineer2026-06-22 07:16:042026-06-24 07:13:17What Is the Difference Between EPC and Turnkey Contract Models in Energy Projects? https://anengjipower.com/wp-content/uploads/2026/06/anengji-commercial-solar-plus-storage-benefits-site.webp
675
1000
Charging Station Engineer
https://anengjipower.com/wp-content/uploads/2025/09/anengji-dc-fast-charging-station-manufacturer-and-supplier-logo-white-1.png
Charging Station Engineer2026-06-20 14:34:102026-06-20 14:37:43What Are the Top Benefits of Solar Battery Storage in Factories?
https://anengjipower.com/wp-content/uploads/2026/06/anengji-commercial-solar-plus-storage-benefits-site.webp
675
1000
Charging Station Engineer
https://anengjipower.com/wp-content/uploads/2025/09/anengji-dc-fast-charging-station-manufacturer-and-supplier-logo-white-1.png
Charging Station Engineer2026-06-20 14:34:102026-06-20 14:37:43What Are the Top Benefits of Solar Battery Storage in Factories? https://anengjipower.com/wp-content/uploads/2026/06/modular-commercial-solar-battery-storage-cabinet.webp
675
1000
Charging Station Engineer
https://anengjipower.com/wp-content/uploads/2025/09/anengji-dc-fast-charging-station-manufacturer-and-supplier-logo-white-1.png
Charging Station Engineer2026-06-18 09:16:522026-07-03 03:05:13What Is Solar Battery Storage? Complete C&I Engineering Guide
https://anengjipower.com/wp-content/uploads/2026/06/modular-commercial-solar-battery-storage-cabinet.webp
675
1000
Charging Station Engineer
https://anengjipower.com/wp-content/uploads/2025/09/anengji-dc-fast-charging-station-manufacturer-and-supplier-logo-white-1.png
Charging Station Engineer2026-06-18 09:16:522026-07-03 03:05:13What Is Solar Battery Storage? Complete C&I Engineering Guide

Leave a Reply
Want to join the discussion?Feel free to contribute!