

Introduction
A 2026 Energy Conversion and Management: X study, “Economic Viability of Stationary Lithium-Ion Battery Storage Systems for Industrial Customers”, modelled 5,359 German industrial load profiles. Under reference-year 2024 conditions, 77.8% achieved positive net savings with at least one implementable operating strategy; three-shift and continuous-operation sites reached 97.7%, while single-shift sites below 2,500 equivalent full-load hours could barely exploit the tested strategies. These are study results, not a forecast for your factory. They show why C&I energy storage ROI for factories depends on the measured load shape—not on annual kWh or a battery catalogue alone.
The practical risk is easy to miss. A battery may have enough nominal energy yet fail to hold the official billing peak because the event lasts longer than expected, the power conversion system reaches its limit, or recharging creates a second peak. This guide turns those problems into a calculation that finance, engineering and procurement can audit: billable peak reduction, event kWh, recharge window, annual deductions and downside payback.
The short answer: annual gross peak-shaving value equals the verified reduction in billed peak kW multiplied by the applicable capacity or demand rate for each billing period. Net value is lower after charging energy, conversion losses, auxiliary consumption, degradation or throughput cost, maintenance and other project expenses. If the tariff does not reward a lower peak—or the battery cannot affect the official meter—the peak-shaving saving may be zero.
Why Factory BESS Savings Differ
Annual electricity consumption is a poor shortcut for battery economics. Two plants can each consume 2 GWh per year while presenting completely different opportunities. A continuous-operation factory may have a high, predictable base load and repeatable price-shifting windows. A single-shift workshop may have one irregular startup peak followed by long periods of low demand. Their annual kWh looks similar; their dispatchable value does not.
Three German studies show the difference from useful angles. Their results should not be blended into one “industry average,” because each uses a different dataset, model and commercial boundary:
- Operating pattern changes the opportunity. The 2026 study of 5,359 sites reported positive net savings at 77.8% of sites under at least one implementable strategy using 2024 market conditions. The result rose to 97.7% for three-shift and continuous-operation sites, but single-shift sites below 2,500 full-load hours could barely use the tested strategies. The buyer lesson is not “77.8% of projects will be profitable.” It is that shift pattern and load shape belong in the first feasibility screen.
- Bill savings and grid impact can move in different directions. DLR, KIT and the University of Cologne’s 2026 “Flexibility at a Cost” study optimized more than 800 real German industrial profiles. It reported an average 14.3% reduction in electricity procurement costs under its model, while companies using the atypical-grid-use regime increased maximum peak load by 51.7% on average in that policy scenario. A factory should therefore model both its bill and the resulting point-of-connection peak instead of assuming that a cheaper dispatch is automatically grid-friendly.
- The economic optimum may be smaller than the proposed cabinet. KIT’s “Optimal Design of Energy Storage System for Peak-Shaving in Industrial Production” found that a 38.4 kW / 38.4 kWh lithium-ion system produced the best result in its example: €980 per year of cost saving and a 33.8 kW peak reduction. That is one case, not a transferable specification. Its value is the method: optimize against the actual peak and tariff before selecting the product.
In practice, four inputs explain most of the gap between a promising proposal and a bankable result:
- The billing rule: which meter, interval and tariff component actually rewards the reduction.
- The peak shape: required kW, event duration and how often the event occurs.
- The recovery window: whether the battery can recharge before the next event without creating a new peak.
- The net-cost boundary: installed project cost, losses, auxiliary consumption, degradation allowance, maintenance and any non-overlapping revenue.
This is why annual consumption alone is not enough. The factory’s interval profile, tariff contract and operating calendar must control the calculation.
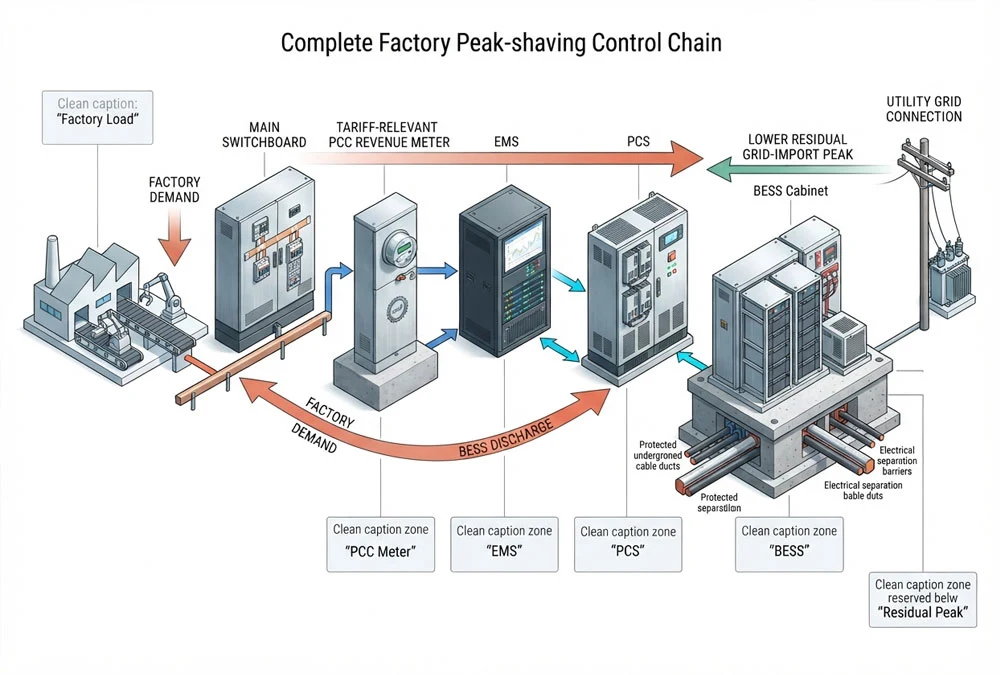
Start With the Billable Peak
The first engineering question is not “How large should the battery be?” It is “Which measured quantity creates the cost?” Trace the chain from the bill line to the tariff rule, revenue meter, aggregation interval and control target. A BESS installed behind the wrong meter can operate perfectly while producing no saving on the charge the investment model assumed.
Europe requires particular care. The European Union Agency for the Cooperation of Energy Regulators explains in its 2025 report on electricity network tariff methodologies that tariff structures differ by national context and that no single design fits every country. Germany is not one uniform price either: the Bundesnetzagentur Monitoring Report 2025 shows network-tariff variation across network areas for its stated industrial customer case.
This is where factory teams often lose confidence in supplier estimates. One proposal uses a German annual capacity price, another assumes a monthly US demand charge, and a third multiplies a wholesale spread by the battery nameplate kWh. The numbers look precise but describe different commercial mechanisms. The solution is to record the jurisdiction, network area, tariff name, customer class, effective date, billing interval and meter before entering a single saving.
- Tariff: identify the capacity, demand, contracted-power, ratchet or time-window rule that is actually avoidable.
- Meter: confirm that BESS discharge changes the official billing point, not only a downstream dashboard.
- Interval: use the same fixed or rolling interval and time zone as the revenue meter.
- Baseline: compare similar production states, excluding known shutdowns or new-load changes where the agreed method requires it.
Calculate Peak-Shaving Savings
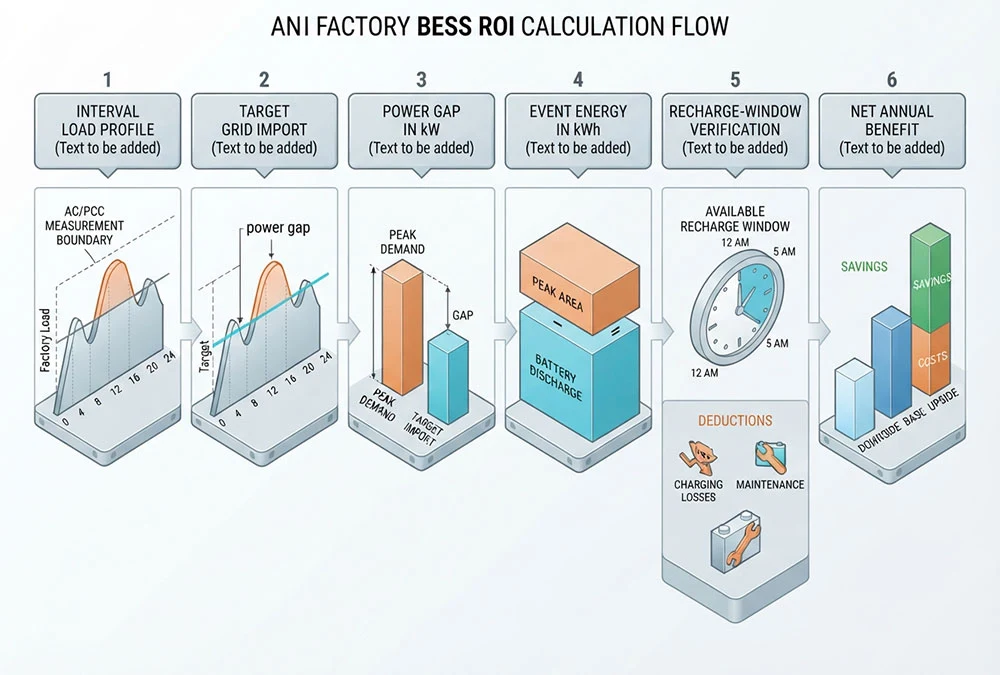
Set the target import
For every tariff-relevant interval, calculate the power above the proposed grid-import target:
Power gap at interval t = max(0, factory importt − target import)
Do not automatically set the target equal to the transformer limit or the PCS rating. It must be technically achievable and commercially useful. An aggressive target may require too much power for too long, increasing project cost faster than the additional saving.
Find the event energy
Power tells you how far the load must be reduced. Energy tells you how long the BESS must hold that reduction. Sum the area above the target using the actual interval duration:
Delivered AC event energy = Σ(power gapt × interval hours)
Preliminary nominal-energy screen = delivered AC energy ÷ (usable SoC fraction × AC delivery efficiency)
The second equation is an early screen, not a final product specification. Temperature derating, auxiliary loads, unavailable modules, protected reserve, end-of-life capacity and the contractual measurement boundary must still be added.
Recalculate the billed maximum
The commercial result is usually not the average kW discharged. It is the highest residual interval left after dispatch in each applicable billing period:
Residual billed peakm = max(factory importt − verified BESS outputt)
Gross avoided peak chargem = (baseline billed peakm − residual billed peakm) × applicable ratem
A detail experienced operators learn quickly: the BESS can control 99 peaks and miss the one interval that sets the charge. A monthly dashboard may celebrate high discharge availability while finance sees almost no reduction. The acceptance test should therefore compare the EMS output and the official meter using synchronized clocks, the same aggregation window and the same tariff period.
Worked Factory ROI Example
Illustrative calculation only: the following values are not an AnengJi quotation, European tariff average, product guarantee or actual project result. Replace every input with the factory’s verified data.
Assume a plant reaches 1,150 kW and wants to hold grid import at 950 kW for a 45-minute production event. The headline power gap is 200 kW. If that full gap lasts for 0.75 hours, delivered event energy is 150 kWh AC. With an illustrative 85% usable operating band and 92% AC delivery efficiency, the preliminary nominal-energy screen is:
150 kWh ÷ (0.85 × 0.92) = 191.8 kWh nominal before reserve, aging and contingency
Now assume—only to demonstrate the arithmetic—that the fictional tariff values verified peak reduction at €10/kW per month, the full installed project costs €180,000, and annual operating-value deductions include charging, losses, degradation allowance, monitoring and maintenance. The resulting sensitivity is more useful than one optimistic answer.
| Illustrative case | Verified peak reduction | Gross annual peak value | Annual deductions | Net annual benefit | Simple payback |
|---|---|---|---|---|---|
| Downside | 130 kW | €15,600 | €4,800 | €10,800 | 16.7 years |
| Base | 180 kW | €21,600 | €5,200 | €16,400 | 11.0 years |
| Upside | 200 kW | €24,000 | €5,600 | €18,400 | 9.8 years |
The table deliberately produces an unexciting result. That is useful. It tells the owner that peak shaving alone may not support the investment under these fictional inputs. The correct next step is not to hide the downside case. It is to test lower-cost operational measures, improve the peak target, verify additional non-conflicting value streams, obtain a complete installed quotation, or decide not to proceed.
For a broader explanation of the operating method, the existing guide to peak-shaving battery operation can provide background. The calculation on this page remains the decision boundary: only verified residual peaks belong in the ROI.
Test the Recharge Window
A peak-shaving model that ends when discharge stops is incomplete. The battery must recover before the next qualifying event, and its charging power appears somewhere in the factory’s electrical balance. If charging overlaps a compressor restart, refrigeration cycle, process heater or EV fleet arrival, the BESS can create the next maximum it was meant to prevent.
This problem is frustrating because the battery dashboard can still look healthy. State of charge returns to target and the system reports the expected discharged energy, yet the billing meter records a new peak. The remedy is to simulate the full charge–discharge–recovery cycle at the same PCC and interval used for the tariff.
- Cap charge power against the forecast factory load and import limit.
- Include PCS, transformer and auxiliary consumption in the declared boundary.
- Preserve enough time and SoC for the next expected production event.
- Test abnormal days, not only the cleanest representative day.
- Define what happens when data communication, forecasting or a battery block is unavailable.
Do Not Count the Same Battery Twice
Peak shaving, backup, energy arbitrage and grid services can all be legitimate objectives. They cannot all assume exclusive access to the same PCS power, usable energy and SoC at the same time. A common buyer pain appears when a supplier’s spreadsheet adds every theoretical revenue stream, while the control specification never says which service wins during a conflict.
Create a resource ledger before adding values. Allocate a time window, maximum charge/discharge power, usable AC energy band, minimum backup reserve and command owner to each service. If 25% of usable energy must remain protected for an outage, that 25% is not guaranteed peak-shaving energy. If the PCS is already discharging 180 kW to hold the factory below its target, only verified remaining capability can be offered elsewhere.
The same discipline applies to avoided downtime. Backup value is not an automatic bill saving, and stored energy alone does not make a plant backup-capable. The electrical design needs an appropriate PCS mode, isolation and protection concept, transfer arrangement, critical-load definition and permitted interruption time. Keep resilience value separate until those functions and costs are actually specified.
Grade the ROI Evidence
Finance may ask for a payback number before the project has decision-grade evidence. Refusing to calculate anything is rarely helpful; presenting false precision is worse. A credible assessment of C&I energy storage ROI for factories should therefore grade the evidence behind the result as well as calculate the result itself. Use the following 100-point screen to show how much confidence the current estimate deserves. This is an editorial project tool, not an industry standard or investment rating.
- 15 points: current tariff and exact bill-line rule;
- 20 points: representative interval load data;
- 10 points: billing meter, PCC and aggregation rule;
- 10 points: comparable production baseline;
- 15 points: complete installed-cost boundary;
- 10 points: efficiency, auxiliaries and availability assumptions;
- 10 points: warranty, degradation and throughput limits; and
- 10 points: recharge, reserve and EMS priority.
Below 50 points, call the result a marketing-level estimate. From 50 to 74, it is a feasibility screen. From 75 to 89, it may support an RFQ if every gap is documented. A score of 90 or more makes the model a stronger investment-review candidate, but it does not replace local electrical engineering, legal, tax or financing approval.
Have interval data and a tariff?
Share the factory peak profile, billing rule and PCC limit for an initial review of the calculation boundary and missing inputs.
Match the Duty to a BESS
Product selection starts only after the power gap, event energy, reserve and recharge window are known. The illustrative factory above needs up to 200 kW and 150 kWh AC for the event. A cabinet with plenty of nominal kWh can still fail if its PCS cannot deliver 200 kW at the agreed boundary.
| Published AnengJi reference | First screening role | Buyer consequence |
|---|---|---|
| 100.48 kWh integrated cabinet with 30/40/50 kW rated AC options | Localized low-power peak, pilot system or solar self-consumption with a limited AC duty | One unit cannot meet the illustrative 200 kW peak duty. Parallel design changes controls, protection and economics. |
| 261.25 kWh class with a published 125 kW rated AC reference | Factory events within the AC limit, or modular multi-cabinet deployment | A single cabinet has enough headline energy for the example but not enough power. Two units require a new full-system calculation. |
| 210 kW / 418 kWh European configuration | A candidate for a roughly 200 kW duty where the higher energy allowance supports reserve, longer events or solar shifting | It clears the example’s headline power and energy screen, but final AC energy, 800 V interface, losses, reserve, grid connection and ROI still need verification. |
| 1 MWh and containerized systems | Longer industrial events, multiple duties or larger coordinated loads | A larger system may clear the duty but reduce ROI if the additional capacity has no verified use. |
These are manufacturer-published reference ratings, not independent performance results or automatic recommendations. The 261 kWh to 5 MWh system comparison can help an EPC screen format and power-conversion boundaries after the duty is defined. The final quotation must declare nominal DC energy, usable AC energy, PCS output, voltage, auxiliaries, reserve, operating temperature, degradation basis and acceptance-test point.
Put Warranty and Service Into the ROI
A ten-year payback model should not assume ten years of unrestricted battery operation just because the warranty headline says “10 years.” Calendar term, discharged throughput, equivalent cycles, temperature, average SoC, depth of discharge, maintenance and data retention can all affect coverage. The model should use the first applicable expiry trigger and the remedy actually written into the contract.
For applicable AnengJi BESS configurations, 10-year warranty coverage can be offered. AnengJi’s published BESS information currently describes a 5-to-10-year range depending on the system model and application. The ten-year option is most valuable when the signed schedule also identifies the start date, throughput or cycle allowance, capacity-retention curve, operating limits, covered components, labour and logistics responsibility, and post-repair acceptance test.
Service geography belongs in the same calculation. A replacement part has limited value if diagnosis, customs, lifting, installation or recommissioning remain unassigned. AnengJi publishes European after-sales support, EU-based onsite support for qualifying customized projects, and a wider overseas service presence. The project quotation should still name the nearest service route, response process, spare-parts arrangement and which costs are included for the specific site.
Before relying on the ten-year term, use the detailed BESS warranty comparison method to align the operating model with contractual throughput and evidence requirements. A long warranty improves bankability only when the planned dispatch stays inside its measurable conditions.
Prepare a Decision-Grade Data Pack
A supplier cannot calculate factory savings from annual kWh, transformer size and one electricity bill. Ask the utility, metering provider or energy-management platform for the underlying interval data and provide one common input pack to every bidder:
- 12–24 months of electricity bills where available;
- at least 12 representative months of interval demand data where available;
- the current tariff, network area, supply contract and billing methodology;
- the revenue-meter location, interval definition and time zone;
- single-line diagram, transformer rating, PCC and written import/export limits;
- production schedule, major load events and planned process changes;
- PV, generator and EV-charging time series where applicable;
- critical-load and backup-reserve requirement;
- candidate BESS efficiency, auxiliary, availability, degradation and warranty documents; and
- a normalized installed scope covering civil works, grid interface, controls, testing and commissioning.
This data pack also protects the EPC. If every supplier uses the same peak target, AC/PCC boundary, reserve, tariff and acceptance method, differences between quotations become visible. Without that common basis, the lowest price may simply contain the most exclusions.
Factory C&I Energy Storage ROI FAQ
How much can a factory save with C&I energy storage?
There is no defensible universal percentage. Calculate the change in each applicable bill line from interval data, then subtract charging, losses, degradation or throughput cost, O&M and other project expenses. Use downside, base and upside cases.
Does peak shaving reduce total energy consumption?
Not necessarily. Peak shaving primarily changes maximum grid power in kW. Battery conversion and auxiliary loads consume energy, so a lower peak should not be reported as energy-efficiency savings unless total consumption is independently reduced.
What data are needed for a reliable ROI?
At minimum: current tariff and bills, representative interval demand, meter/PCC definition, production calendar, connection limits, complete installed cost, efficiency and auxiliary assumptions, warranty/degradation limits, and the proposed EMS dispatch hierarchy.
Can charging create a new factory peak?
Yes. Recharge adds to underlying factory demand. The EMS should cap charging against the load forecast, transformer and PCC limit, tariff interval and time remaining before the next event.
Should backup value be included in the same ROI?
Only when the protected loads, permitted interruption, electrical architecture, reserve SoC, test method and economic value are defined. Do not count the same power and energy as both guaranteed peak-shaving capacity and protected backup reserve.
Why do supplier payback estimates differ?
They may use different tariff periods, load years, meter boundaries, usable-energy assumptions, availability, value streams, installed scope, warranty limits or financing inputs. Normalize these fields before comparing the final payback.
Turn the Estimate Into a Decision
A credible factory-storage decision follows a disciplined order: verify the tariff, clean the interval data, calculate the residual peaks, test the recharge window, allocate reserve, normalize installed cost, run scenarios and grade the evidence. Only then should the team select a cabinet or container.
The result may support a C&I BESS project. It may show that production sequencing or load control should solve part of the peak first. It may also show that the tariff does not justify storage today. All three outcomes are more valuable than a confident-looking ROI built from the wrong boundary.
Ready to test a real factory profile?
Share the site country, tariff, interval data, PCC limit and operating objective to discuss a suitable BESS configuration and the remaining evidence needed.
Related Articles
- Translate a manufacturing event into a testable BESS duty
- Compare cabinet and container power–energy boundaries
- Check whether warranty limits match the planned dispatch
- Map the installed BESS EPC scope and delivery interfaces
Sources and Evidence
- Economic Viability of Stationary Lithium-Ion Battery Storage Systems for Industrial Customers — 2026 German industrial load-profile study; accessible abstract used.
- Flexibility at a Cost: Industrial Battery Storage and the Breakdown of Grid Fee Fairness in Germany — 2026, DLR/KIT/University of Cologne.
- Optimal Design of Energy Storage System for Peak-Shaving in Industrial Production — KIT industrial case and optimization method.
- Electricity Network Tariff Methodologies in Europe — ACER, 2025.
- Monitoring Report 2025 — Bundesnetzagentur industrial network-tariff context.

 https://anengjipower.com/wp-content/uploads/2026/06/epc-vs-turnkey-solar-project-bess.webp
675
1000
Charging Station Engineer
https://anengjipower.com/wp-content/uploads/2025/09/anengji-dc-fast-charging-station-manufacturer-and-supplier-logo-white-1.png
Charging Station Engineer2026-06-22 07:16:042026-06-24 07:13:17What Is the Difference Between EPC and Turnkey Contract Models in Energy Projects?
 https://anengjipower.com/wp-content/uploads/2026/06/anengji-commercial-solar-plus-storage-benefits-site.webp
675
1000
Charging Station Engineer
https://anengjipower.com/wp-content/uploads/2025/09/anengji-dc-fast-charging-station-manufacturer-and-supplier-logo-white-1.png
Charging Station Engineer2026-06-20 14:34:102026-06-20 14:37:43What Are the Top Benefits of Solar Battery Storage in Factories?
 https://anengjipower.com/wp-content/uploads/2026/06/modular-commercial-solar-battery-storage-cabinet.webp
675
1000
Charging Station Engineer
https://anengjipower.com/wp-content/uploads/2025/09/anengji-dc-fast-charging-station-manufacturer-and-supplier-logo-white-1.png
Charging Station Engineer2026-06-18 09:16:522026-07-03 03:05:13What Is Solar Battery Storage? Complete C&I Engineering Guide


Leave a Reply
Want to join the discussion?Feel free to contribute!